. 2023 Dec 27;12:RP88795. doi: 10.7554/eLife.88795

Figure 3. Δ9-THC exposure provokes an increase in glycolytic rates in ESCs and EpiLCs.

(A) Diagram illustrating Δ9-THC exposure scheme and experimental strategy. (B) The NAD(P)+/NADPH ratio of stem cells exposed to the different Δ9-THC doses was normalized to the one measured in the mock-treated condition. Median and associated errors were plotted in whisker boxplots. (C) Mean fluorescence intensity (MFI) associated with the Mitotracker CMXRos stain was normalized to the one measured in the mock-treated condition. Median and associated errors were plotted in whisker boxplots. (D) Median and associated error of the maximal extracellular acidification rate (ECAR) measured in cells exposed to the different Δ9-THC doses and normalized to the protein content was plotted in whisker boxplots. (E) Median and associated error of the maximal oxygen consumption rate (OCR) measured in cells exposed to the different Δ9-THC doses and normalized to the protein content was plotted in whisker boxplots. For (B and C), 5 technical repeats of 3 biological repeats (n=15) were plotted. One representative experiment out of three independent experiments was used to plot results in (D and E). Statistical significance: *(p<0.05), **(p<0.01), ***(p<0.001), ****(p<0.0001).

Figure 3.

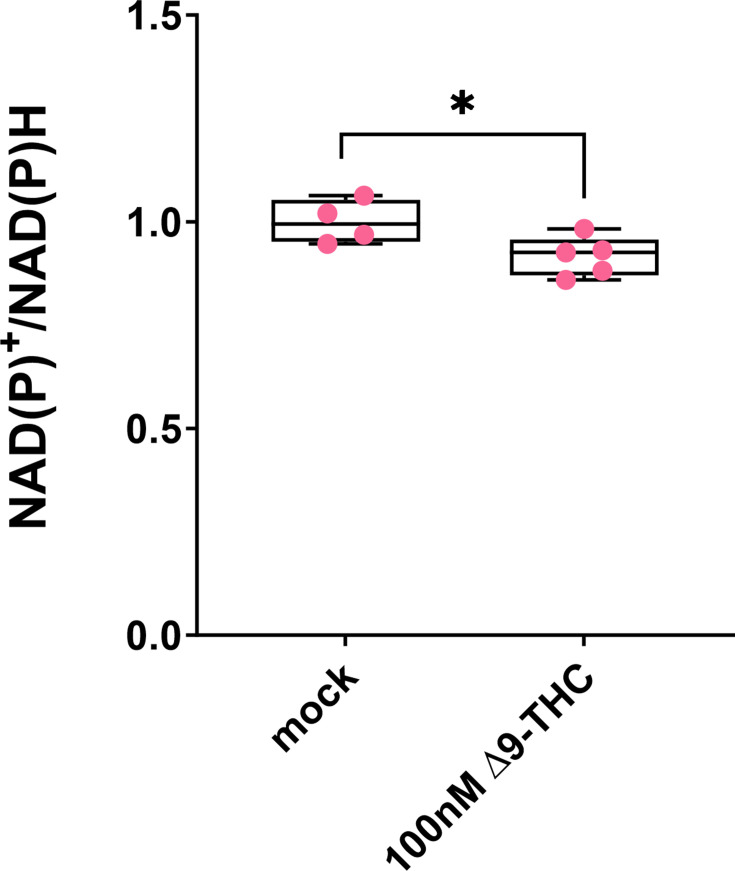
Figure 3—figure supplement 1. hESCS metabolism is slightly but significantly impacted by Δ9-THC exposure.

Figure 3—figure supplement 1.

The NAD(P)+/NADPH ratio of hESCs exposed to 100 nM of Δ9-THC was normalized to the one measured in the mock-treated condition. Median and associated errors were plotted in whisker boxplots. Five exposure experimental replicates were plotted. Statistical significance: *(p<0.05).
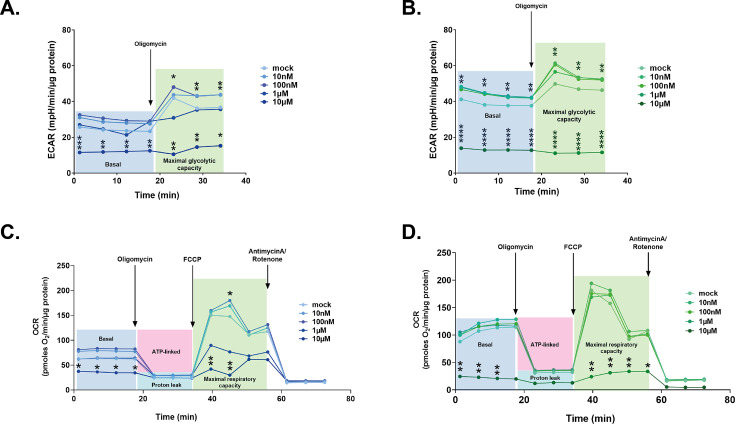
Figure 3—figure supplement 2. Extracellular acidification rates and oxygen consumption rates in ESCs and EpiLCs upon Δ9-THC exposure.

Figure 3—figure supplement 2.

(A and B) Traces were plotted for the extracellular acidification rate (ECAR) measurements in ESCs and EpiLCs, respectively, exposed to the different Δ9-THC doses indicated and normalized to the protein content. The oligomycin injection time is indicated by an arrow and allows to differentiate basal glycolytic rate from maximal glycolytic rate (when mitochondria are inhibited). The datapoints used in the main figure correspond to the first timepoint in the maximal glycolytic capacity section. (C and D) Traces were plotted for the oxygen consumption rate (OCR) measurements in ESCs and EpiLCs, respectively, exposed to the different Δ9-THC doses indicated and normalized to the protein content. The oligomycin, FCCP and AntimycinA/Rotenone injection times are indicated by arrows and allow to differentiate basal respiration from ATP-coupled respiration and maximal respiratory capacity. The datapoints used in the main figure correspond to the second timepoint in the maximal respiratory capacity section. FCCP: Carbonyl cyanide-p-trifluoromethoxyphenylhydrazone. Groups and repeats are as described in Figure 3. Statistical significance: *(p<0.05), **(p<0.01), ****(p<0.0001).