. 2023 Dec 27;12:RP88795. doi: 10.7554/eLife.88795

Figure 4. Δ9-THC-induced glycolysis sustain anabolism and ESCs proliferation (A) Diagram illustrating Δ9-THC exposure scheme and experimental strategy.

(B) PCA of the metabolomics profiling of either ESCs or EpiLCs mock-exposed or exposed to 100 nM Δ9-THC. (C) Venn diagram showing the overlap in upregulated metabolites following Δ9-THC exposure in ESCs and EpiLCs. (D and E) KEGG metabolite sets enrichment analysis for upregulated metabolites in ESCs and EpiLCs, respectively, performed by MetaboAnalyst (Pang et al., 2022). KEGG, Kyoto Encyclopedia of Genes and Genomes. (F) Whisker boxplot indicating the median cellular viability of stem cells exposed to 100 nM of Δ9-THC and 10 mM of 2-DG, as indicated, and their associated errors. (G) The median numbers of viable cells exposed to 100 nM of Δ9-THC and 10 mM of 2-DG, as indicated, were normalized to their own control (+/-2 DG). Median and associated errors were plotted in whisker boxplots. (H) The NAD(P)+/NADPH ratio of stem cells exposed to 100 nM of Δ9-THC and 10 mM of 2-DG, as indicated, was normalized to the one measured in the mock-treated condition (+/-2 DG). Median and associated errors were plotted in whisker boxplots. At least three independent biological repeats with three technical replicates (N=3, n=3). Statistical significance: *(p<0.05), **(p<0.01), ***(p<0.001), ****(p<0.0001).

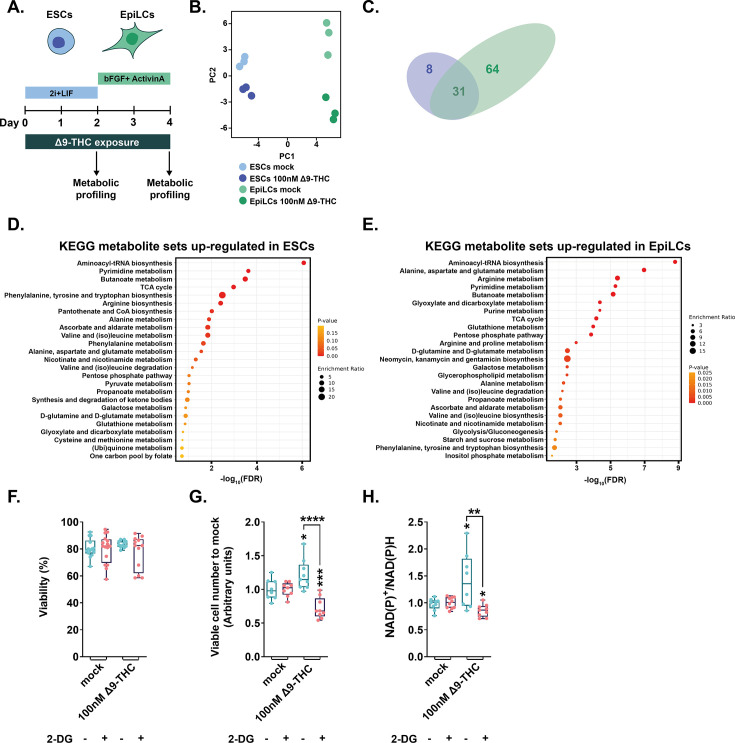
Figure 4.

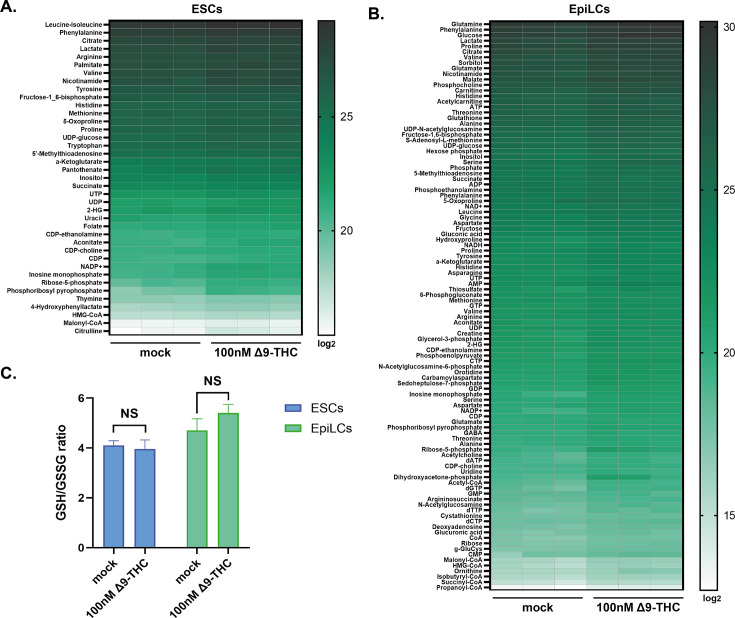
Figure 4—figure supplement 1. Metabolite profiling in ESCs and EpiLCs upon Δ9-THC exposure.

Figure 4—figure supplement 1.

(A and B) Heatmaps showing the log2 of the amount of each metabolite upregulated in ESCs and EpiLCs upon exposure to 100 nM of Δ9-THC. The relative amounts of metabolites were normalized to the mean value across all samples for one same condition and to the number of viable cells harvested in parallel on a control plate. (C) Histograms showing the ratio of reduced to oxidized glutathione (GSH/GSSG) based on the amounts measured in the metabolomics profiling. N=3, n=3.
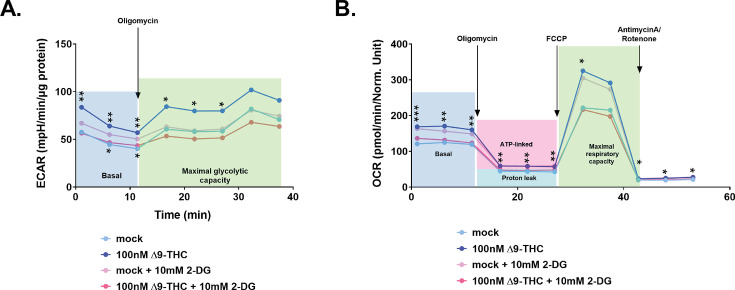
Figure 4—figure supplement 2. Extracellular acidification rates and oxygen consumption rates in ESCs upon Δ9-THC and 2-DG exposure.

Figure 4—figure supplement 2.

(A) Traces were plotted for the extracellular acidification rate (ECAR) measurements in ESCs exposed to 100 nM of Δ9-THC and 10 mM of 2-DG, as indicated, and normalized to the protein content. The oligomycin injection time is indicated by an arrow and allows to differentiate basal glycolytic rate from maximal glycolytic rate (when mitochondria are inhibited). (B) Traces were plotted for the oxygen consumption rate (OCR) measurements in ESCs exposed to 100 nM of Δ9-THC and 10 mM of 2-DG, as indicated, and normalized to the protein content. The oligomycin, FCCP and AntimycinA/Rotenone injection times are indicated by arrows and allow to differentiate basal respiration from ATP-coupled respiration and maximal respiratory capacity. FCCP: Carbonyl cyanide-p-trifluoromethoxyphenylhydrazone. Statistical significance: *(p<0.05), **(p<0.01). N=3, n=3.