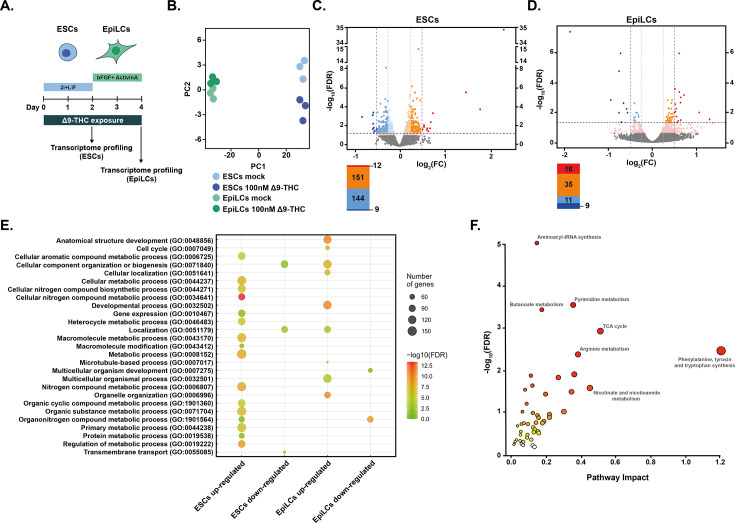
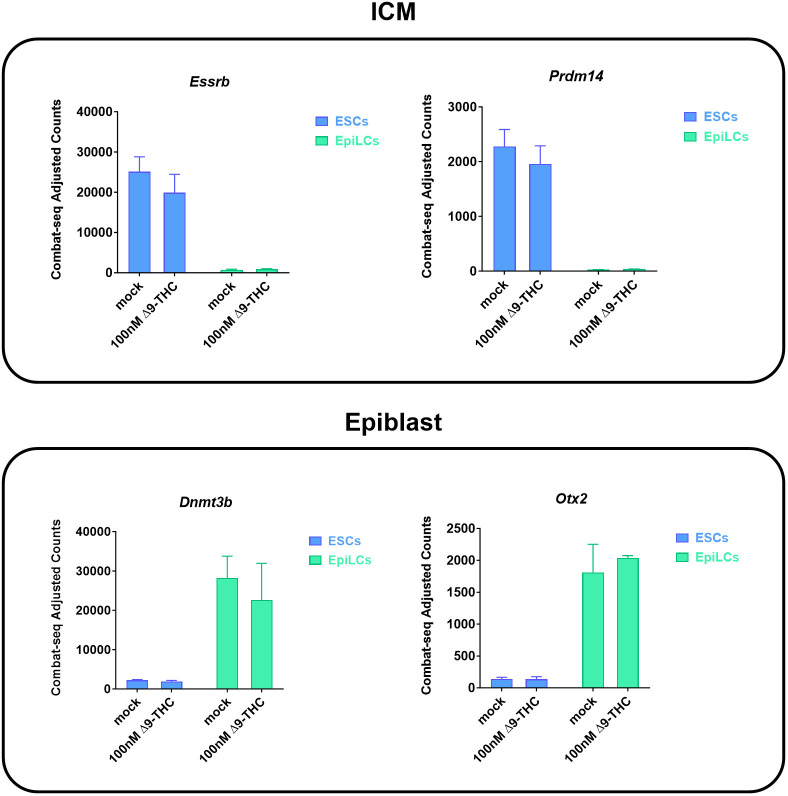
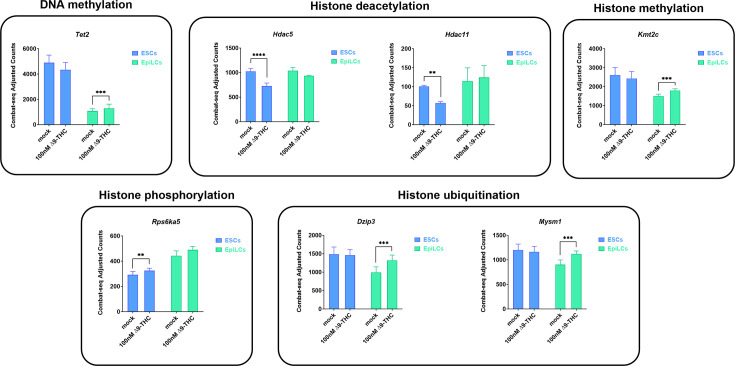
Figure 5. Metabolic changes following Δ9-THC exposure in ESCs are transcriptionally encoded.
(A) Diagram illustrating Δ9-THC exposure scheme and experimental strategy. (B) PCA of the transcriptomics profiling of either ESCs or EpiLCs mock-exposed or exposed to 100 nM Δ9-THC. (C and D) Volcano plot in ESCs and EpiLCs, respectively, showing significance [expressed in log10(adjusted p-value or false-discovery rate, FDR)] versus fold-change [expressed in log2(fold-change, FC)]. Thresholds for significance (adjusted p-value ≤0.05) and gene expression fold-change [|(log2(FC))|>0.25 or |log2(FC)|>0.5] are shown as dashed lines. Color code is as follows: log2(FC) >0.5 in red, log2(FC) >0.25 in orange, log2(FC) >0 in light orange, log2(FC) <0 in light blue, log2(FC) >−0.25 in blue, log2(FC) >0.5 in dark blue and p-value <0.01 in pink. (E) Gene ontology (GO) terms associated with up- and downregulated DEGs [|(log2(FC)|>0.25 and p<0.01)] in ESCs and EpiLCs as determined by g:Profiler (Raudvere et al., 2019). (F) Joint pathway analysis performed by the multi-omics integration tool of MetaboAnalyst (Pang et al., 2022). The p-values were weighted based on the proportions of genes and metabolites at the individual pathway level.


