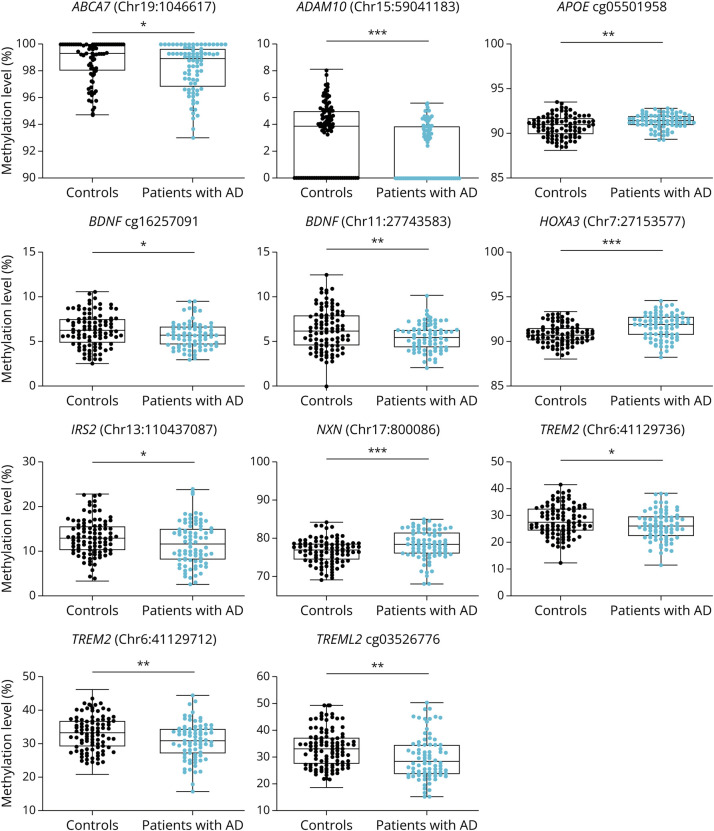
Figure 1. DNA Methylation Levels in PBLs From AD vs Controls.
The panel shows boxplots which represent the percentage of DNA methylation for ABCA7, ADAM10, APOE, BDNF, HOXA3, IRS2, NXN, TREM2, and TREML2 genes in PBLs measured by pyrosequencing. *p < 0.05; **p < 0.01; ***p < 0.001. AD = Alzheimer disease; PBL = peripheral blood leukocyte.

