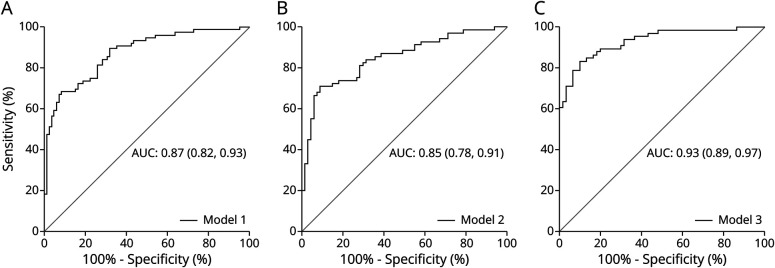
Figure 2. AUC Graph for Each Multivariable Logistic Regression Model.
The graphs represent the AUC (95% CI) showing the performance of diagnostic prediction for model 1 (A), model 2 (B), and model 3 (C) for distinguishing AD and controls in the iBEAS cohort. AD = Alzheimer disease; AUC = area under the receiver operating characteristic curve.

