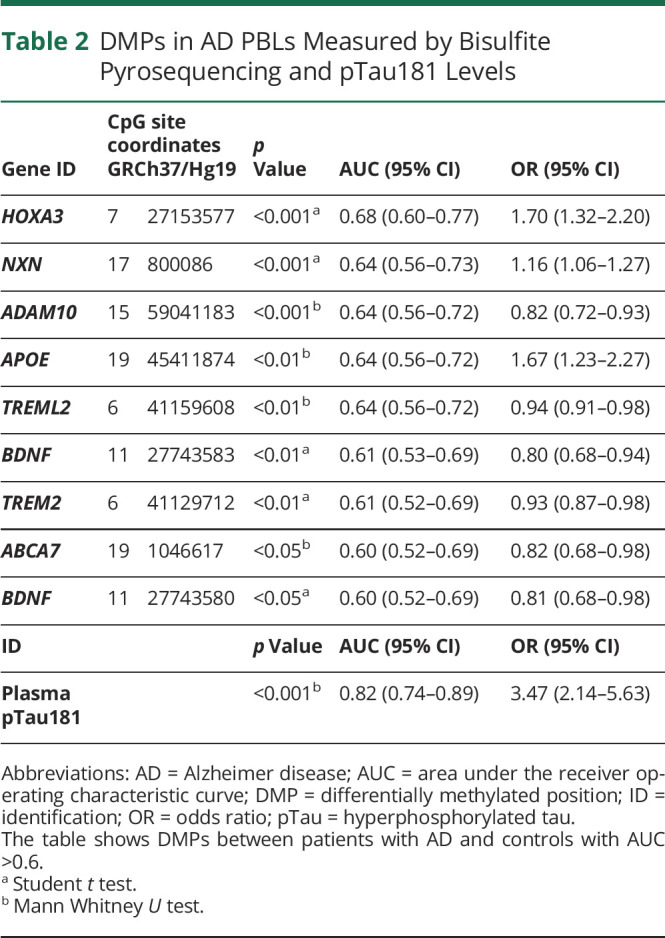
Table 2.
DMPs in AD PBLs Measured by Bisulfite Pyrosequencing and pTau181 Levels

| Gene ID | CpG site coordinates GRCh37/Hg19 | p Value | AUC (95% CI) | OR (95% CI) | |
| HOXA3 | 7 | 27153577 | <0.001a | 0.68 (0.60–0.77) | 1.70 (1.32–2.20) |
| NXN | 17 | 800086 | <0.001a | 0.64 (0.56–0.73) | 1.16 (1.06–1.27) |
| ADAM10 | 15 | 59041183 | <0.001b | 0.64 (0.56–0.72) | 0.82 (0.72–0.93) |
| APOE | 19 | 45411874 | <0.01b | 0.64 (0.56–0.72) | 1.67 (1.23–2.27) |
| TREML2 | 6 | 41159608 | <0.01b | 0.64 (0.56–0.72) | 0.94 (0.91–0.98) |
| BDNF | 11 | 27743583 | <0.01a | 0.61 (0.53–0.69) | 0.80 (0.68–0.94) |
| TREM2 | 6 | 41129712 | <0.01a | 0.61 (0.52–0.69) | 0.93 (0.87–0.98) |
| ABCA7 | 19 | 1046617 | <0.05b | 0.60 (0.52–0.69) | 0.82 (0.68–0.98) |
| BDNF | 11 | 27743580 | <0.05a | 0.60 (0.52–0.69) | 0.81 (0.68–0.98) |
| ID | p Value | AUC (95% CI) | OR (95% CI) | ||
| Plasma pTau181 | <0.001b | 0.82 (0.74–0.89) | 3.47 (2.14–5.63) | ||
Abbreviations: AD = Alzheimer disease; AUC = area under the receiver operating characteristic curve; DMP = differentially methylated position; ID = identification; OR = odds ratio; pTau = hyperphosphorylated tau.
The table shows DMPs between patients with AD and controls with AUC >0.6.
Student t test.
Mann Whitney U test.
