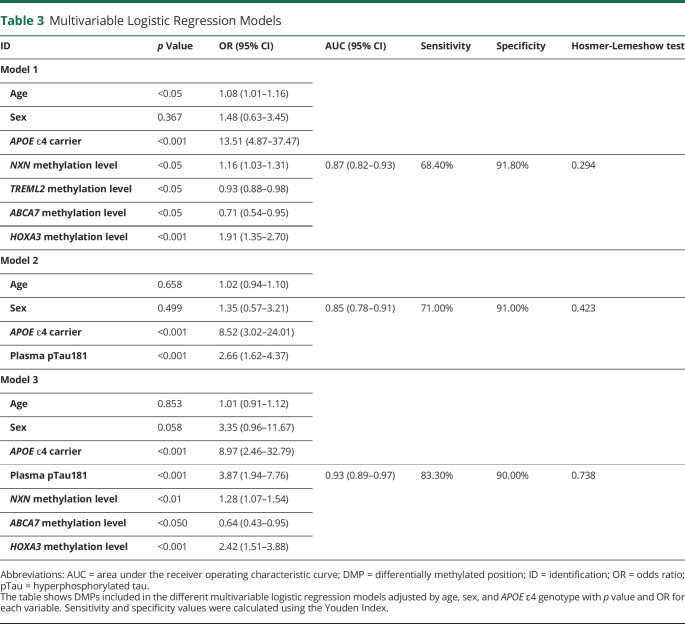
Table 3.
Multivariable Logistic Regression Models
| ID | p Value | OR (95% CI) | AUC (95% CI) | Sensitivity | Specificity | Hosmer-Lemeshow test |
| Model 1 | ||||||
| Age | <0.05 | 1.08 (1.01–1.16) | ||||
| Sex | 0.367 | 1.48 (0.63–3.45) | ||||
| APOE ɛ4 carrier | <0.001 | 13.51 (4.87–37.47) | ||||
| NXN methylation level | <0.05 | 1.16 (1.03–1.31) | 0.87 (0.82–0.93) | 68.40% | 91.80% | 0.294 |
| TREML2 methylation level | <0.05 | 0.93 (0.88–0.98) | ||||
| ABCA7 methylation level | <0.05 | 0.71 (0.54–0.95) | ||||
| HOXA3 methylation level | <0.001 | 1.91 (1.35–2.70) | ||||
| Model 2 | ||||||
| Age | 0.658 | 1.02 (0.94–1.10) | ||||
| Sex | 0.499 | 1.35 (0.57–3.21) | 0.85 (0.78–0.91) | 71.00% | 91.00% | 0.423 |
| APOE ɛ4 carrier | <0.001 | 8.52 (3.02–24.01) | ||||
| Plasma pTau181 | <0.001 | 2.66 (1.62–4.37) | ||||
| Model 3 | ||||||
| Age | 0.853 | 1.01 (0.91–1.12) | ||||
| Sex | 0.058 | 3.35 (0.96–11.67) | ||||
| APOE ɛ4 carrier | <0.001 | 8.97 (2.46–32.79) | ||||
| Plasma pTau181 | <0.001 | 3.87 (1.94–7.76) | 0.93 (0.89–0.97) | 83.30% | 90.00% | 0.738 |
| NXN methylation level | <0.01 | 1.28 (1.07–1.54) | ||||
| ABCA7 methylation level | <0.050 | 0.64 (0.43–0.95) | ||||
| HOXA3 methylation level | <0.001 | 2.42 (1.51–3.88) |
Abbreviations: AUC = area under the receiver operating characteristic curve; DMP = differentially methylated position; ID = identification; OR = odds ratio; pTau = hyperphosphorylated tau.
The table shows DMPs included in the different multivariable logistic regression models adjusted by age, sex, and APOE ɛ4 genotype with p value and OR for each variable. Sensitivity and specificity values were calculated using the Youden Index.

