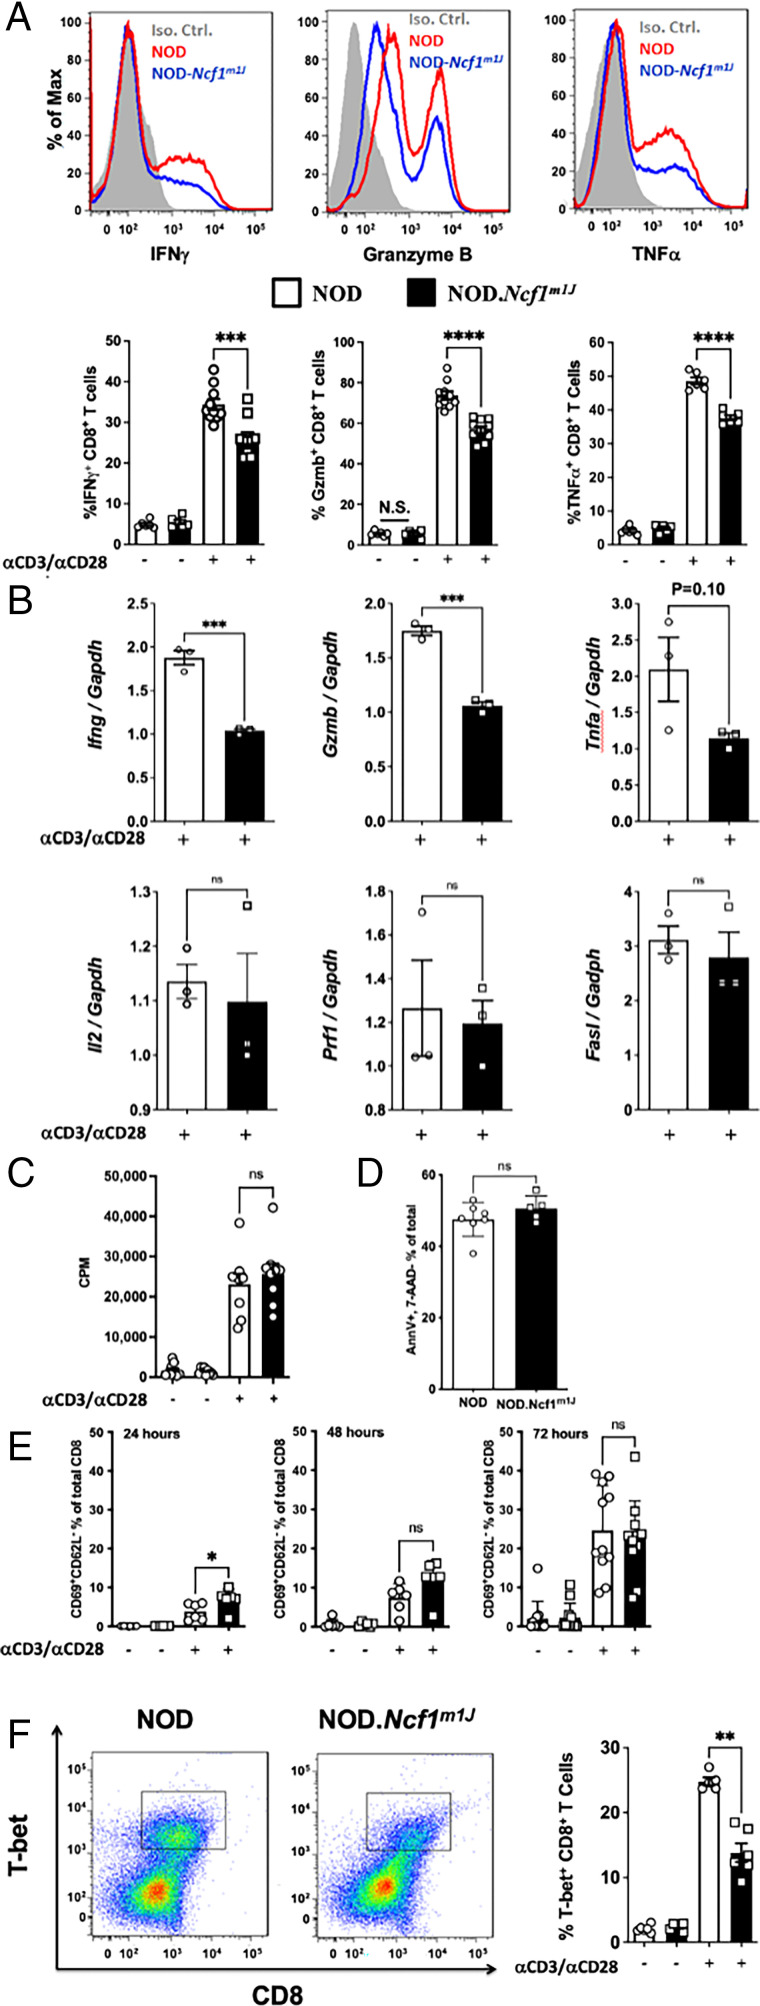
FIGURE 1.
NOD-Ncf1m1J CD8+ T cells exhibit a decrease in proinflammatory cytokine and effector molecule production. (A) Representative histogram and the quantitation of intracellular staining in purified CD8+ T cells after stimulation of NOD (red histogram or open bar) or NOD-Ncf1m1J (blue histogram or black bar) with α-CD3/α-CD28 Abs for 72 h. Gray histogram represents the isotype control. Twelve mice were included in each group. (B) Real-time quantitative PCR of cytokine and effector molecule mRNA in CD8+ T cells after α-CD3/α-CD28 stimulation of NOD (open bar) or NOD-Ncf1m1J (black bar) for 48 h. PCR was performed with pooled cDNA from three mice, and results were compiled from three independent experiments performed in triplicate. (C) Proliferation was assessed by 3H-TdR incorporation using CD8+ T cells activated with α-CD3/α-CD28 for 72 h. (D) CD8+ T cell apoptosis 72 h after α-CD3/α-CD28 activation. (E) Surface activation markers were detected using flow cytometry after CD8+ T cells were activated with α-CD3/α-CD28 for 24, 48, and 72 h. (F) Representative dot plot and the quantitation of intracellular staining of T-bet in purified CD8+ T cells after α-CD3/α-CD28 stimulation for 72 h. At least four mice were included in each group. Data in the bar graphs are represented as mean ± SEM. Statistical analysis used Student t test (ns, p > 0.05, *p < 0.05, **p < 0.01, ***p < 0.001, ****p < 0.0001).

