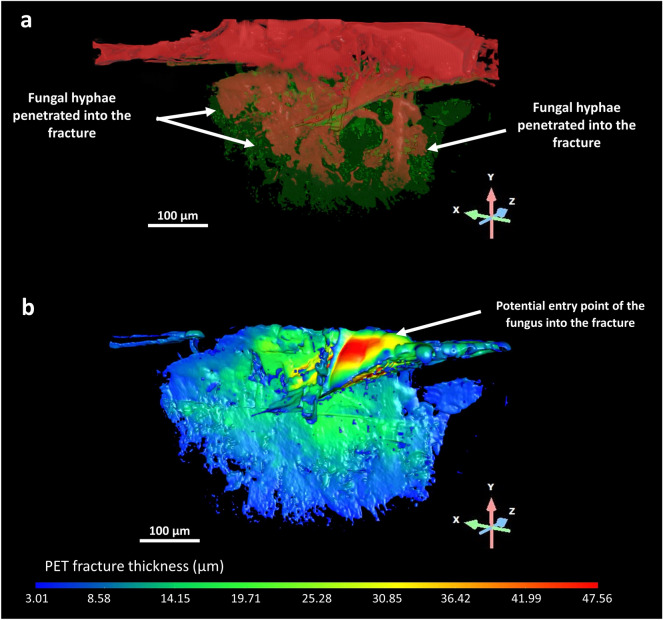
Figure 8.
3D distribution and colonisation of F2 in PET fracture. The fracture previously highlighted in Fig. 7a was further investigated to get a better understanding of the three-dimensional distribution and colonisation pattern of the fungal strain within the fracture. (a) The surface fracture in PET is reported as a green mesh where the fungal strain, labelled in red, exhibited deep hyphal penetration, as indicated by the white arrows. (b) The fracture area was then converted to a thickness mesh. The peripheral area of the three-dimensional thickness colour-based map, depicted in thin blue, had a thickness ranging between 3 and 10 μm. It can be observed that this peripheral area has not yet been colonised by the fungus. The adjacent green region, corresponding to a width of 25 μm down to 10 μm, was formed by the growing fungal mycelium that increased the fragmentation of the substrate. The upper red area of the thickness map represents the wider zone (47.5 μm) of the fracture and could represent the access point of the fungus into the fracture.

