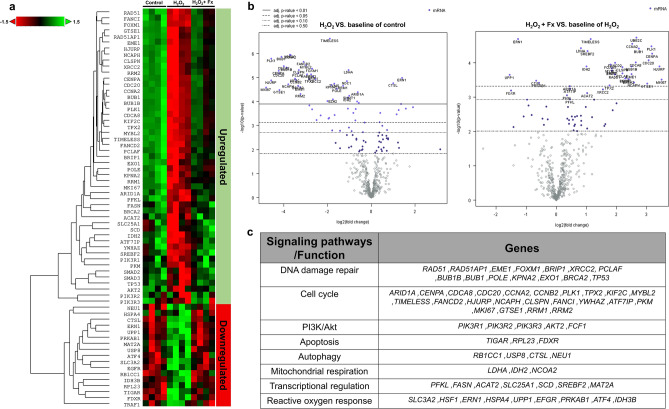
Figure 10.
NanoString analysis of differential gene expression in PL-MSCs under oxidative stress conditions. (a) Heatmap of differentially expressed genes in 750 μM H2O2-treated PLMSCs and PL-MSCs treated with 750 μM H2O2 together with 5 μM fucoxanthin. (b) The volcano plot presents the distribution of differentially expressed genes (DE). (c) Summary of genes belonging to various metabolic pathways that showed statistical significance between treatment groups.

