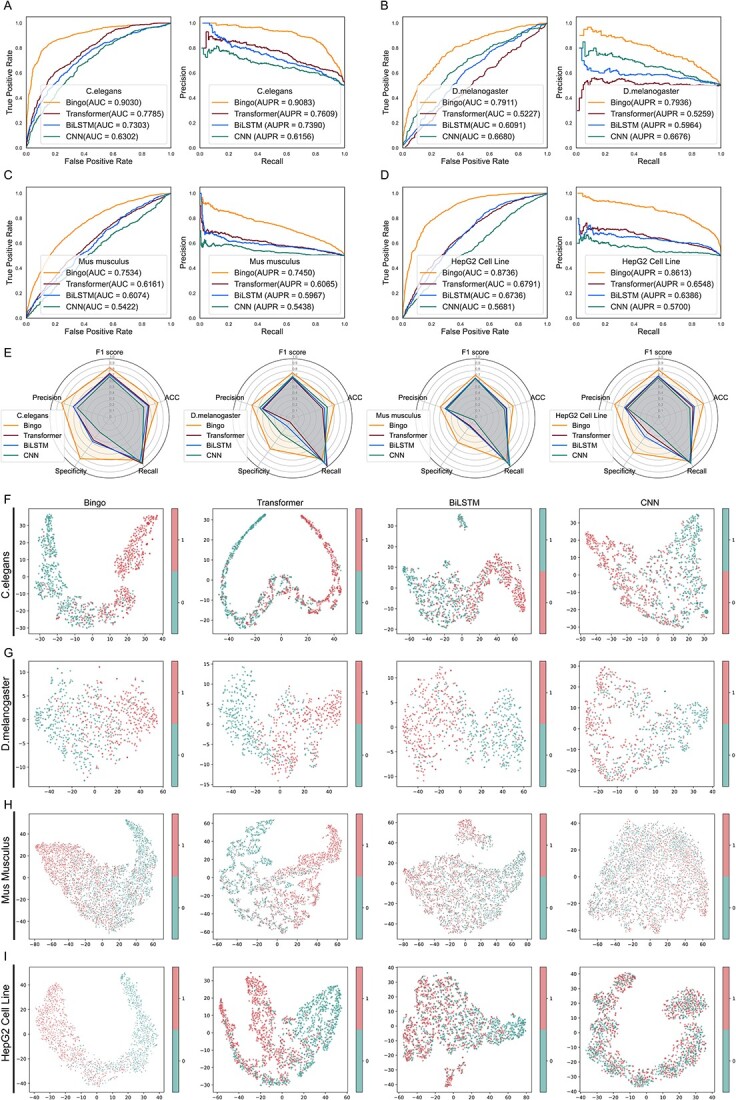
Figure 2.

Comparison of the overall performance of Bingo and other methods using balanced data (10-fold cross validation). (A–D) The ROC and PR curves of Bingo (and its competing methods on balanced datasets for C. elegans, D. melanogaster, M. musculus and the H. sapiens HepG2 cell line. (E) Performances of Bingo, Transformer, BiLSTM and CNN using four balanced datasets, in terms of ACC, Precision, Recall, F1 score and Specificity (10-fold cross validation). (F–I). Feature distributions for Bingo, Transformer, BiLSTM and CNN using balanced datasets for C. elegans, D. melanogaster, M. musculus and HepG2 cells, respectively. Red and green dots denote essential (positive) and non-essential (negative) genes, respectively.
