Figure 2.

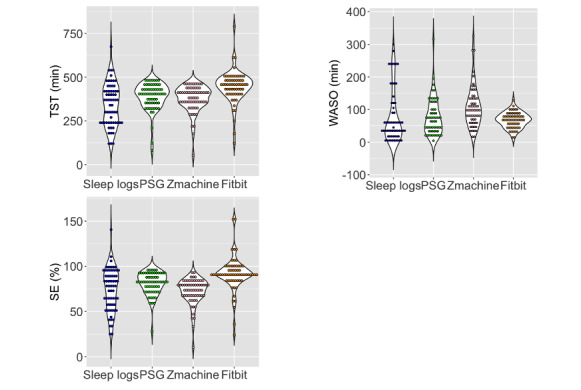
Comparison of sleep parameters for each sleep measure. The y-axis in total sleep time (TST) and wake after sleep onset (WASO) represent minutes, while the y-axis in sleep efficiency (SE) represents percentages. PSG: polysomnography.

Comparison of sleep parameters for each sleep measure. The y-axis in total sleep time (TST) and wake after sleep onset (WASO) represent minutes, while the y-axis in sleep efficiency (SE) represents percentages. PSG: polysomnography.