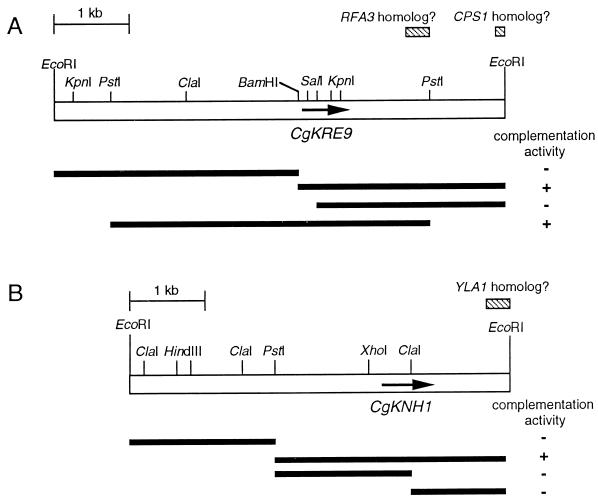
FIG. 3.
Restriction maps and deletional analysis of inserts of C. glabrata genomic DNA on pSB2-1 and pSBG9-1. Open bars indicate the inserts on pSB2-1 (A) and pSBG9-1 (B). Fragments used for deletional analysis are represented by solid bars. The presence and absence of complementation activity in Tets KRE9 knh1Δ cells are indicated as + and −, respectively. Arrows indicate ORFs of CgKRE9 (A) and CgKNH1 (B). Hatched bars indicate regions with homology to the syntenic S. cerevisiae genes.

