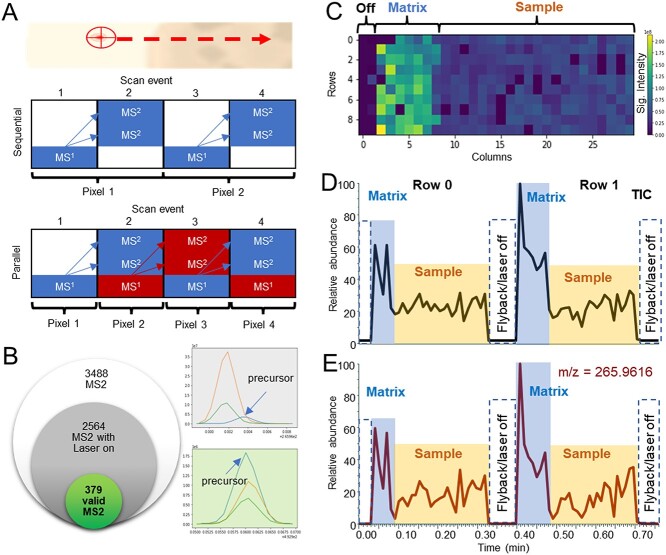
Figure 1.
DDA principles and matrix effect in MSI. (A) Graphical representation of sequential or parallel MS and MS2 acquisition during MSI experiment. (B) Venn diagram with different quality of MS2 spectra from HCCA_MS2 file reporting total MS2, the number of MS2 with active laser and number of MS2 passing the quality test with 5 ppm tolerance. (C) Total ion map report TIC intensity for each pixel from HCCA_MS2 file. (D) TIC from the HCCA_MS2 chromatogram. (E) Extracted ion chromatogram of mass 265.96 which is characteristic of the matrix.

