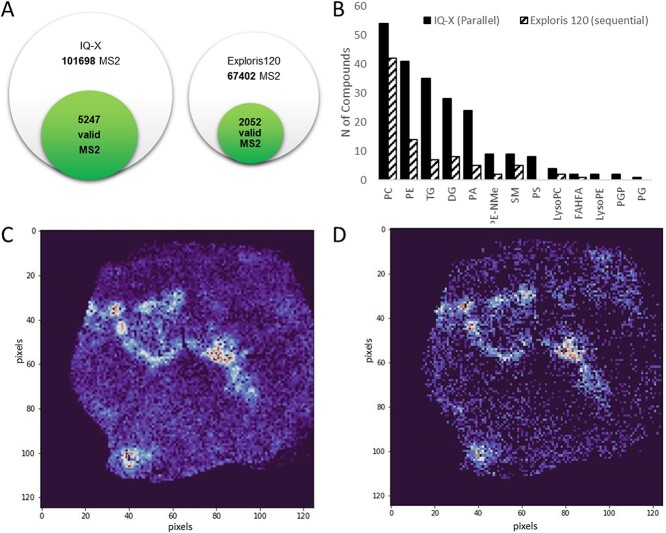
Figure 4.
Parallel and sequential DDA. (A) Venn diagram of the identified metabolites with the two different acquisition methods. (B) Number of identified lipids divided in the different classes. Spatial distribution of a sphingomyelin compound a sphingomyelin compound detect with IQ-X (C) or Exploris 120 (D).

