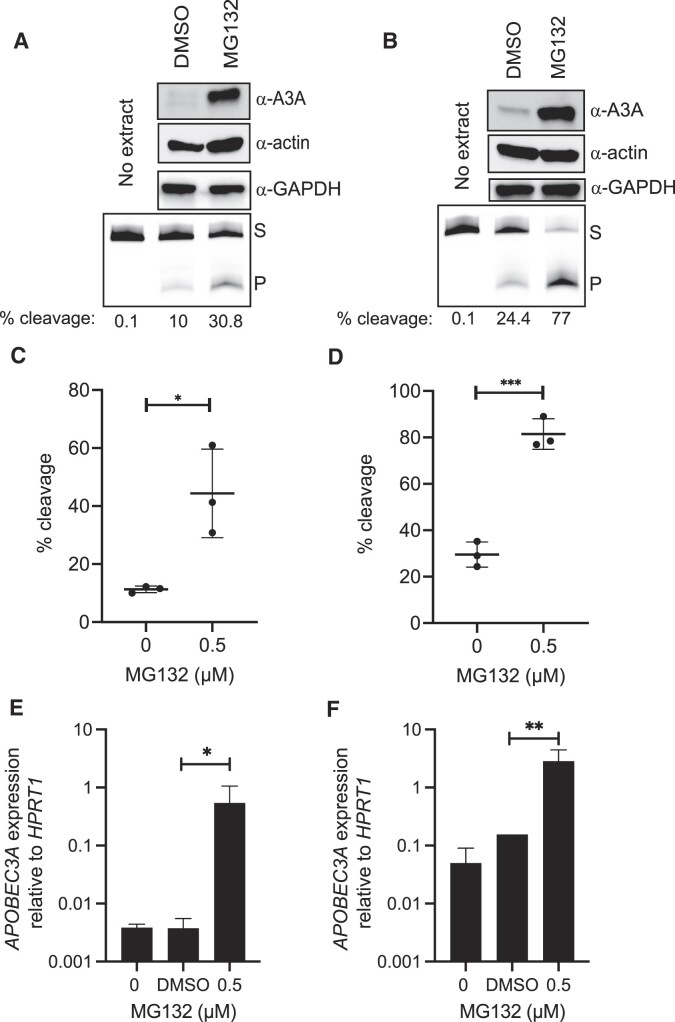
Figure 2.
A3A is increased with inhibition of the UPS by MG132 in BRCA cells. A3A abundance and activity were measured after 24 h treatment with 0.5 μM MG132 in MDA-MB-453 (A, C, E) and BT474 cells (B, D, F). Representative images of western blot GAPDH analysis and denaturing gels for A3A substrate cleavage (A, B). A3A activity was determined with the in vitro cytidine deaminase assay and percent cleavage was calculated and graphed (n = 3). Percent substrate cleaved of untreated and treated MDA-MB-453 (C) and BT474 (D) cells. Significant changes are represented by asterisks to denote P-values of unpaired t-tests comparing MG132 to the DMSO control. Error bars represent one standard deviation. The transcript levels for A3A, when compared to HPRT1, increased significantly by (E) 145-fold (ratio paired t-test; P-value 0.0338) and (F) 18-fold (ratio paired t-test; P-value 0.0019). S, substrate; P, product. *P ≤ 0.05, **P ≤ 0.01 and ***P ≤ 0.001.

