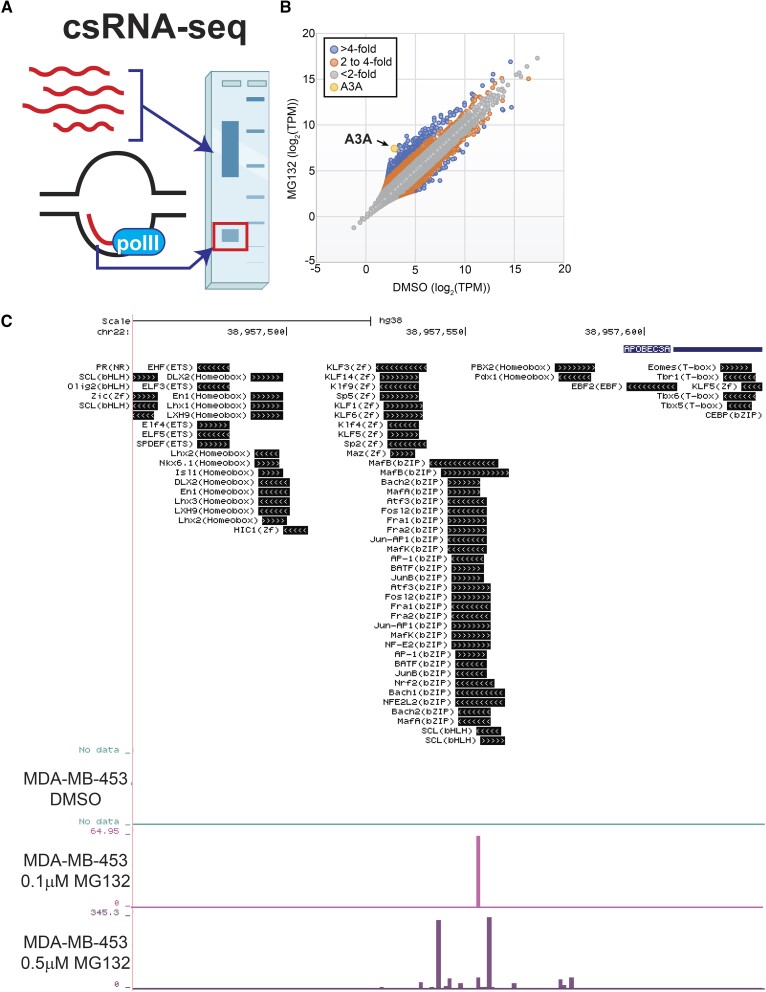
Figure 3.
Nascent A3A transcription is increased upon proteasome inhibition. (A) Schematic of csRNA-seq methodology that captures actively initiating or ‘nascent’ transcription. Created with BioRender.com. (B) Comparison of csRNA-seq reads per gene promoter region (quantified in tags per million (TPM)) in DMSO-treated or 0.5 μM MG132-treated MDA-MB-453 cells. Dots indicate transcribed regulatory elements, such as promoters or putative enhancers. (C) UCSC data browser image of csRNA-seq reads aligning to the A3A promoter region following DMSO, 0.1 μM MG132 or 0.5 μM MG132 treatment. Known transcription factor binding sites proximal to the transcription start sites of the A3A transcripts are displayed.

