Figure 6.
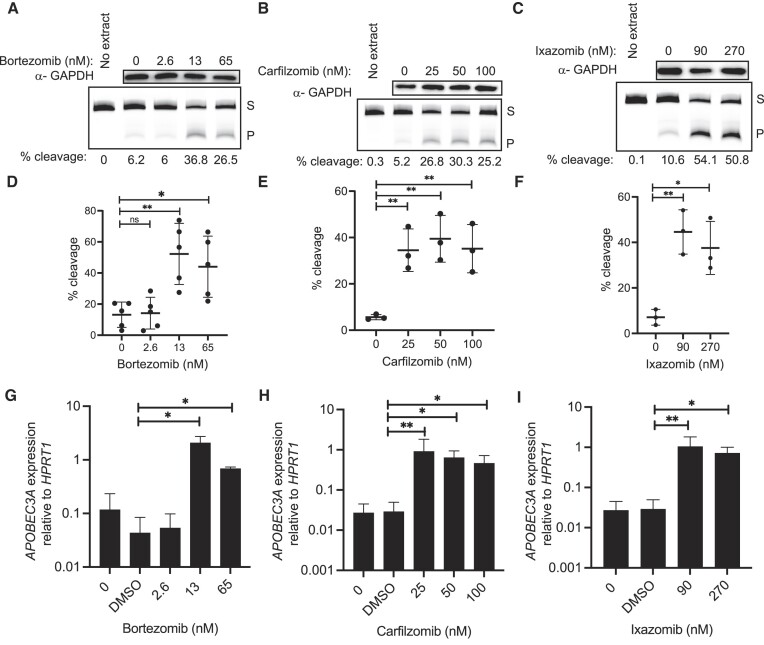
Other UPS inhibitors increase A3A. A3A activity, protein and transcript in BT474 cells after 24 h treatment with clinical proteasome inhibitors. Representative images of western blot GAPDH analysis and denaturing gel for cytidine deaminase assay with percent cleavage shown for (A) bortezomib, (B) carfilzomib and (C) ixazomib. Quantification of percent cleavage for all replicates of (D) bortezomib (n = 5), (E) carfilzomib (n = 3) and (F) ixazomib (n = 3) treated cells. Percent cleavage of activity assays for all replicates of treated cells showed significant differences in activity compared to control, as represented in P-values from unpaired t-test results. Panels (D)–(F) show mean of all replicates; error bars represent one standard deviation. (G–I) A3A expression relative to HPRT1 was evaluated via qRT-PCR. (G) Bortezomib at concentrations of 13 and 65 nM increased A3A 47.7-fold (ratio paired t-test; P-value 0.0106) and 15.8-fold (ratio paired t-test; P-value 0.0236), respectively. (H) Carfilzomib at concentrations of 25, 50 and 100 nM increased A3A 31.2-fold (ratio paired t-test; P-value 0.0075), 21.9-fold (ratio paired t-test; P-value 0.0100) and 16-fold (ratio paired t-test; P-value 0.0124), respectively. (I) Ixazomib at the concentrations of 90 and 270 nM increased A3A 35.8-fold (ratio paired t-test; P-value 0.0051) and 24.7-fold (ratio paired t-test; P-value 0.0324), respectively. S, substrate; P, product. *P ≤ 0.05 and **P ≤ 0.01; ns, non-significant with P-value >0.05.

