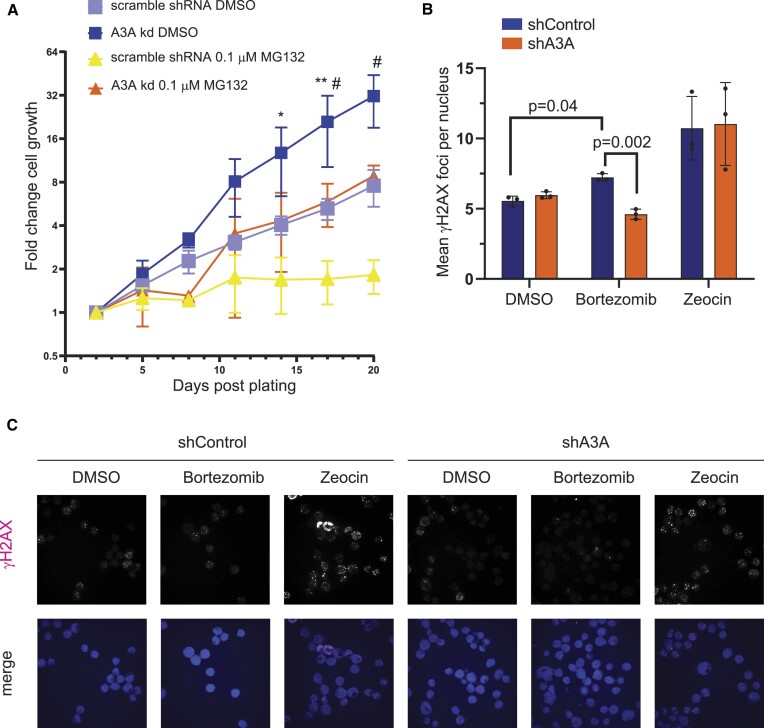
Figure 7.
Proteasome inhibition leads to reduced cell growth. (A) Cell growth of MDA-MB-453 cells expressing an A3A-specific shRNA or scramble shRNA control treated with MG132 or DMSO over the span of 3 weeks counted by bright-field imaging. Plotted mean fold change in cell numbers at various days post-plating among replicates (n = 3). Error bars show one standard deviation. A3A shRNA expressing DMSO-treated cells, scramble shRNA expressing DMSO-treated cells, 0.1 μM MG132-treated A3A shRNA expressing cells, and 0.1 μM MG132-treated scramble shRNA cells are shown. Comparisons for each time point were made by multiple unpaired t-tests between scramble shRNA cells treated with DMSO and scramble shRNA cells treated with MG132 (statistical significance shown by an asterisk), as well as between MG132-treated scramble shRNA cells and A3A shRNA cells (statistical significance shown by a hash symbol). *,#P ≤ 0.05 and **P ≤ 0.01. All other time point comparisons not shown were not significant (P > 0.05). (B) The number of γH2AX foci per nuclei in MDA-MB-453 cells transduced to express either control shRNA (shControl) or A3A-targeting shRNA (shA3A). Statistical significance was determined by paired t-test. Error bars indicate standard deviation. (C) Representative γH2AX images merged with a Hoechst stain used for analysis plotted in Figure 6B.

