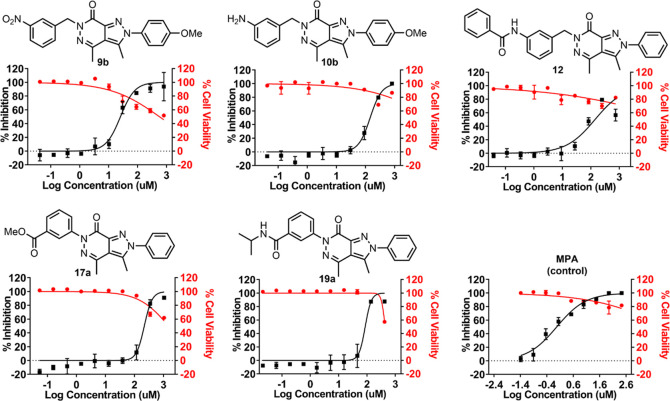
Figure 3.
Dose–response curves of compounds 9b, 10b, 12, 17a, and 19a against ZIKV and the reference inhibitor (MPA-mycophenolate acid). The percentage of ZIKV inhibition is shown in the black line. Percentage cell viability is shown in the red line. A compound shows good activity if the SI value is greater than 10 (SI of 10–6: activity; SI of 6–4: low activity; and SI < 4: no activity). A full antiviral data set for all compounds can be found in the Supporting Information, Table S1.

