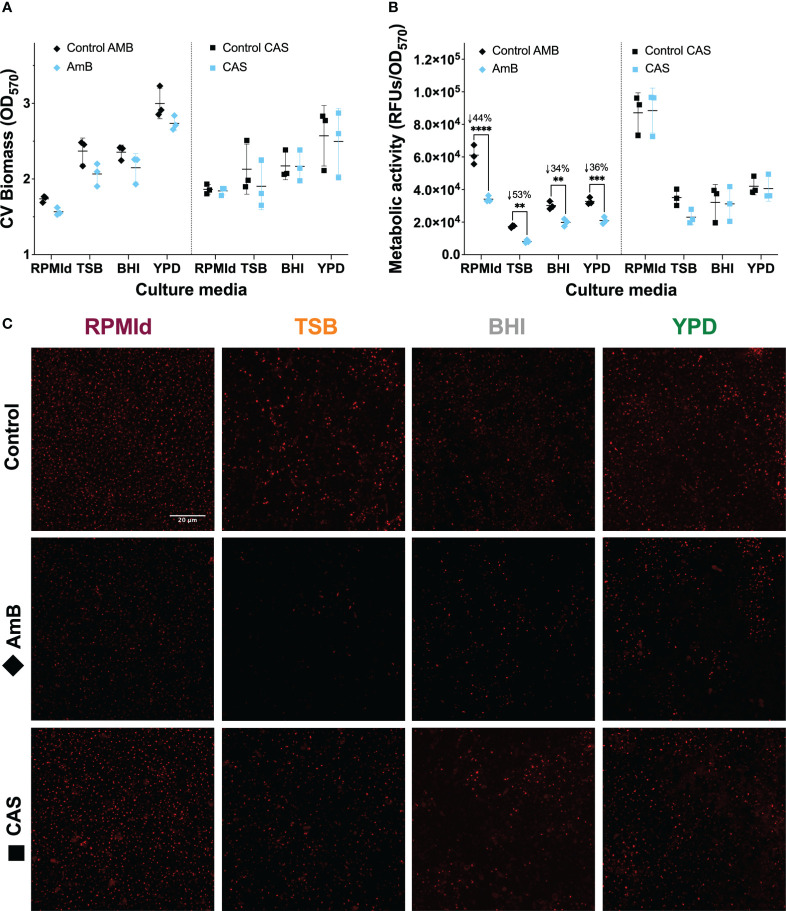
Figure 3.
C. parapsilosis biofilm susceptibility to AmB and CAS at different culture media. 42 h biofilms grown in all media and treated for 6 h with 1.25 mg/mL of AmB and 10 mg/mL of CAS were analyzed by (A) Biomass quantification with Crystal Violet (CV) assay, and metabolic activity evaluation by (B) PrestoBlue assay, and (C) FUN-1 vitality staining. Biofilm experiments were conducted in triplicate. The plotted values represent 3 different biological experiments, with each value corresponding to the mean derived from 3-6 technical replicates. Error bars display mean and standard deviation. Asterisks indicate statistically significant differences versus control in an Ordinary two-way ANOVA with Šidák’s multiple comparison test (∗∗p-value <0.01; ∗∗∗p-value <0.001; ∗∗∗∗p-value <0.0001). The percentage of reduction concerning control is indicated with the symbol ↓ on top of the asterisks. RFUs, Relative Fluorescence Units. Z-stacks of red fluorescence channel display intravacuolar structures as an indicator of metabolically active cells. All images were processed with Image-J. The scale bar (20 mm) is the same for all images.

