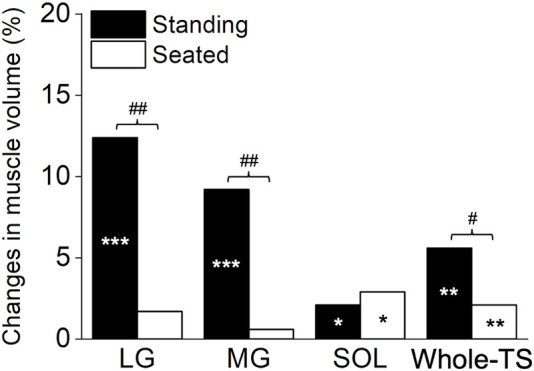
FIGURE 4.

The summary in percentage change based on the mean changes for each muscle and the whole triceps surae. ***p < 0.001, **p < 0.01 and *p < 0.05 difference between times (pre vs. post). ##p < 0.01 and #p < 0.05 difference between conditions (legs). LG, lateral gastrocnemius; MG, medial gastrocnemius; SOL, soleus; Whole-TS, whole triceps surae.
