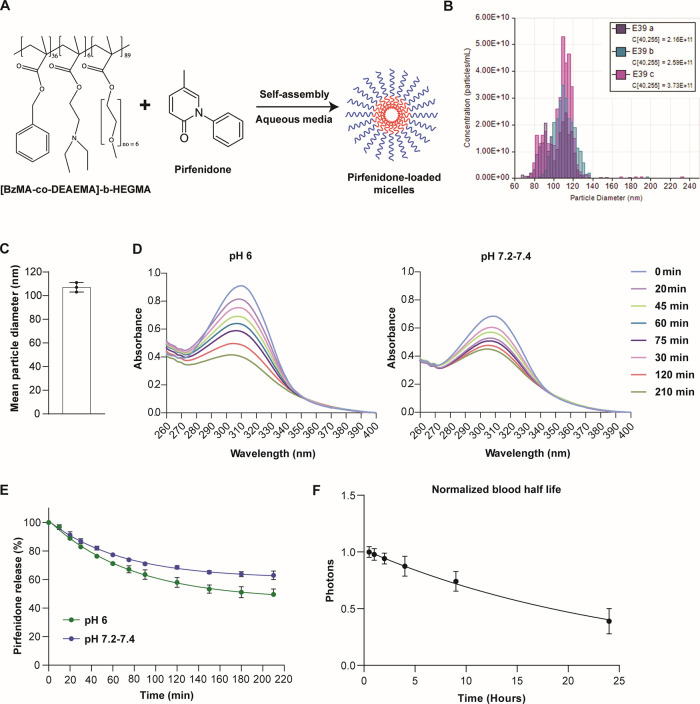
Figure 1.
Characterization of pirfenidone/m. (A) Schematic of the process employed for the formation of pirfenidone-loaded micelles in aqueous media. The micelles were generated by mixing [BzMA-co-DEAEMA]-b-HEGMA and pirfenidone in aqueous conditions. (B) Size distribution of different batches of free micelles and (C) mean diameter size as determined by tunable resistive pulse sensing (TRPS) (n = 3). Data presented as the mean ± SE. (D) UV–vis spectra of the pirfenidone-loaded [BzMA36-co-DEAEMA6]-b-HEGMA89 micelles recorded at different time intervals after being immersed in PBS solution (pH 7.2–7.4) (right plot) and in an aqueous solution at pH = 6.0 (left plot). (E) Pirfenidone release kinetics recorded at different pHs at room temperature: pH 7.2–7.4 (blue), pH 6.0 (green). Average values were recorded from two repetitions. (F) Time-dependent decay of blood concentration after intravenous injection of 10 mg/kg pirfenidone/m i.v. Values are normalized with the data from the first time point, i.e., 30 min. Data are shown as the mean ± SE (n = 4 mice).

