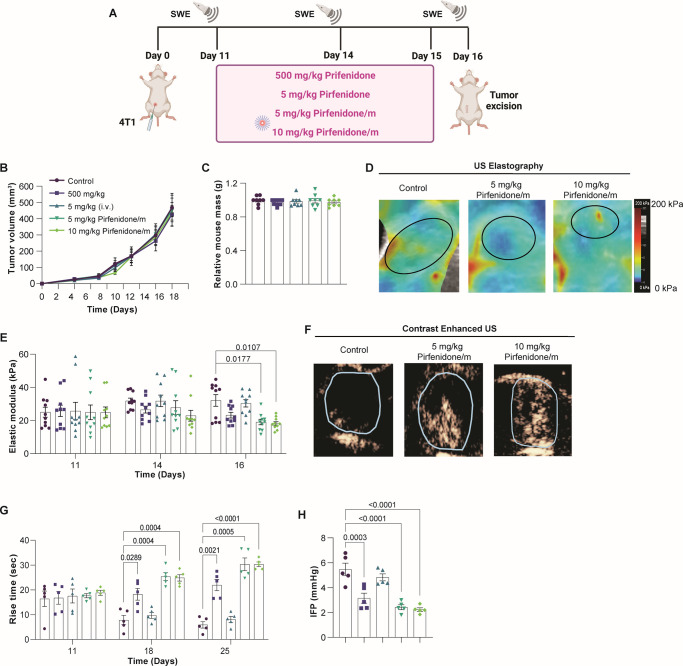
Figure 2.
Pirfenidone/m modulate the physical TME. (A) Schematic of the experimental protocol created with BioRender.com. Effects of free pirfenidone and pirfenidone/m on 4T1 tumor growth (B) (n = 5 mice) and (C) mouse mass (n = 5 mice). (D) Representative SWE images for the control group and the two groups receiving pirfenidone/m at the end of the experimental protocol. The black line denotes the tumor margin. (E) Elastic modulus values measured with SWE (n = 5 mice, N = 2 image fields per mouse). (F) Representative images depicting the spatial distribution of microbubbles with contrast enhanced ultrasound (CEUS) at the time of peak intensity obtained at the end of the experimental protocol (n = 5 mice). (G) Rise time measured with CEUS (n = 5 mice). (H) Interstitial fluid pressure (IFP) measured with the wick-in-needle technique (n = 5 mice). Data are presented as mean ± SE. Statistical analyses were performed using two-way ANOVA with multiple comparisons of the Dunnett test.

