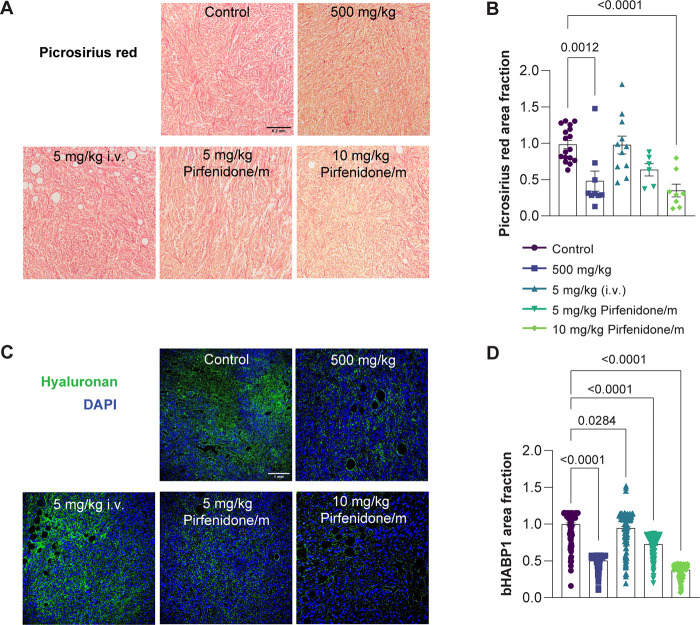
Figure 3.
Pirfenidone/m effectively decrease collagen and hyaluronan levels. (A) Representative light microscope images of Picrosirius red staining (red color). Black scale bar indicates 0.2 mm. (B) Graph depicting the area fraction of Picrosirius red, representing collagen fibers in tissue sections, normalized to the average value in control tumors (n = 3 mice; N = 3 or 4 image fields). (C) Immunofluorescence images showing hyaluronan binding protein staining (bHABP1, green) counterstained with nuclear staining (in blue). The white scale bar denotes a size of 1 mm. (D) Graph of the area fraction of bHABP1 in immunofluorescence images (n = 3 mice, N = 3 or 4 image fields). Data are presented as mean ± SE. Statistical analyses were performed by using ordinary one-way ANOVA with multiple comparison Dunnett test.

