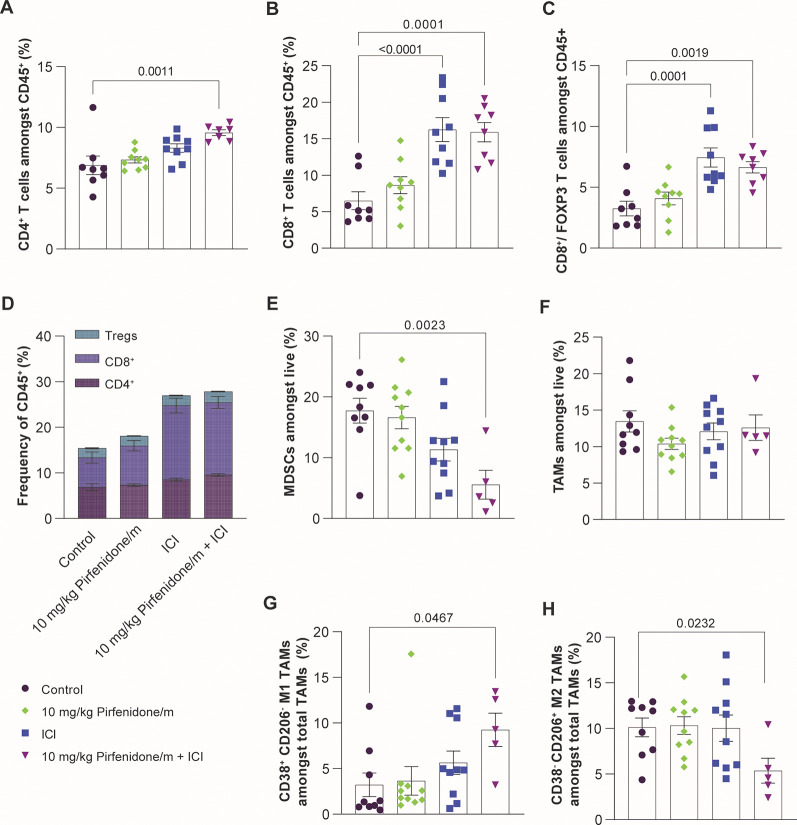
Figure 5.
Pirfenidone/m and ICI increase immune cell infiltration and induce immunostimulation. Quantification of (A) CD3+ CD4+ (SP, single positive) and (B) CD3+ CD8+ (SP, single positive) cells among CD45+ lymphocytes (n = 6–10 mice). (C) Ratio of cytotoxic CD8+ T cells to immunosuppressive CD4+ regulatory T cells (Tregs) (n = 6–10 mice). Tregs are defined as Foxp3+CD127loCD25hi CD4 SP gated on CD45+ lymphocytes. (D) Frequency of CD4+, CD8+, and Tregs in total lymphocyte population (n = 6–10 mice). (E) Quantification of intratumoral MDSCs (CD45+ CD11b+ GR1+) and (F) TAMs (CD45+ CD11b+ GR1– F4/80+) gated on live cells. Percentage of antitumor (G) M1-like TAMs (CD45+ CD11b+ GR1– F4/80+CD206–CD38+) and (H) M2-like TAMs (CD45+ CD11b+ GR1– F4/80+CD206+CD38–) gated on total TAM population (n = 6–10 mice). Data are presented as mean ± SE. Statistical analyses were performed by using ordinary one-way ANOVA with multiple comparisons Dunnett test.

