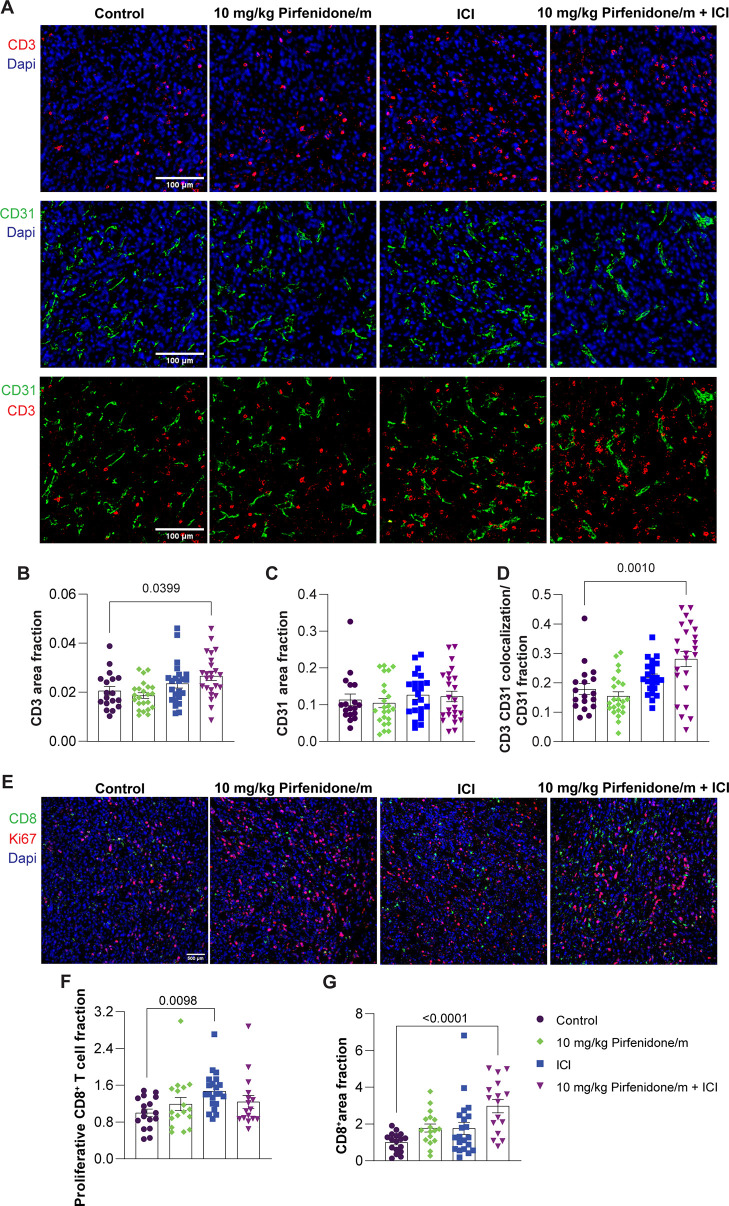
Figure 6.
Pirfenidone micelles combined with ICI increase CD3 and CD8+ T cell density in 4T1 tumors. (A) Representative immunofluorescence images of CD3 staining (red) and CD31 staining (green) counterstained with nuclear staining (blue). White scale bar indicates 0.1 mm. (B) Graph illustrating the area fraction of the CD3 T cell marker in immunofluorescence images standardized to DAPI nuclear staining. (C) Graph depicting the area fraction of the CD31 marker in immunofluorescence images, normalized to DAPI nuclear staining. (D) Graph of the overlapping signal of the CD3 T cell and CD31 endothelial marker in immunofluorescence images. (E) Representative immunofluorescence images of CD8+ T cell staining (green) and proliferation marker, Ki67 staining (red), counterstained with DAPI nuclear staining (blue). White scale bar indicates 0.5 mm. (F) Graph illustrating the area fraction of Ki67 colocalized with CD8+ relative to the total CD8+ area in immunofluorescence images. (G) Graph of the area fraction of the T cell marker CD8+ in immunofluorescence images normalized to DAPI stain. Data are presented as mean ± SE. Statistical analyses were performed by using ordinary one-way ANOVA with multiple comparisons Dunnett test. P-values less than 0.05 are denoted on the graphs.

