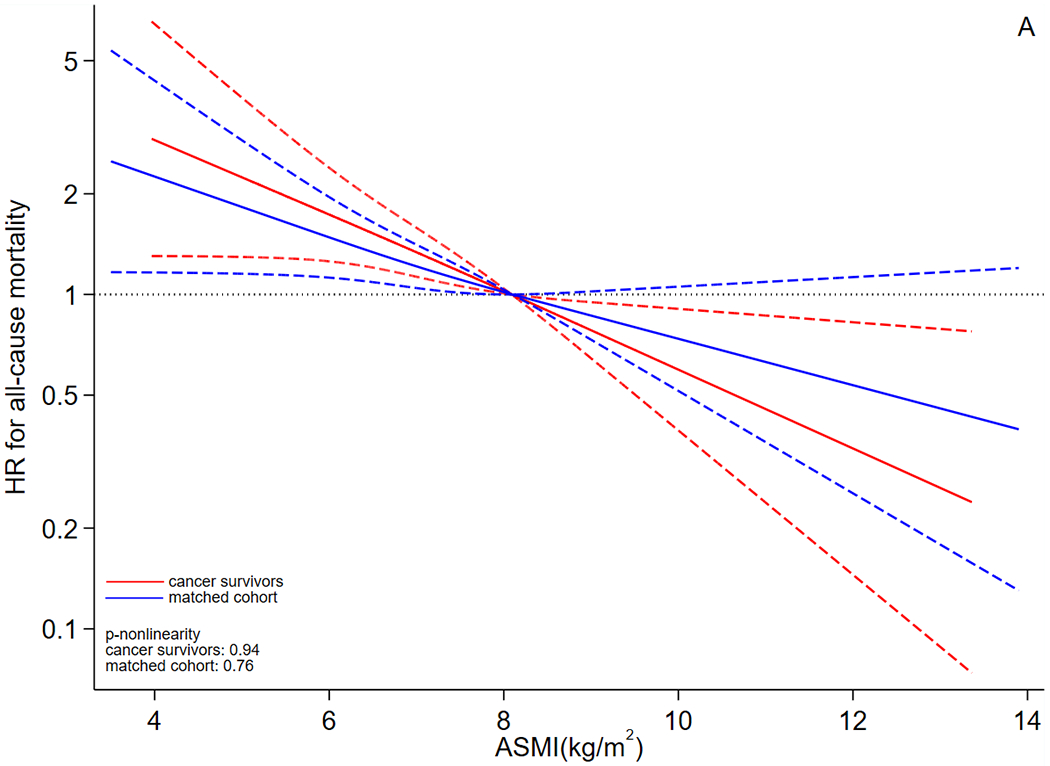
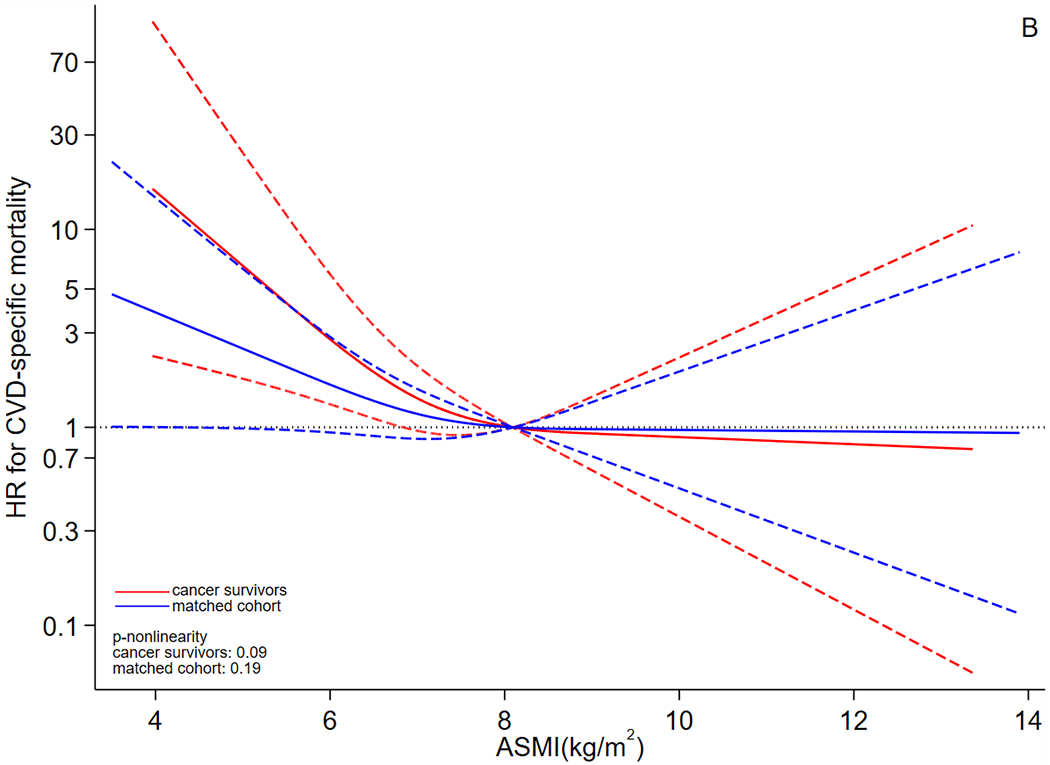
Figure 2.


Dose-response curves for association between ASMI and risk of (A) all-cause and (B) CVD-specific mortality. Abbreviations: ASMI: appendicular skeletal muscle mass index, CVD: cardiovascular disease, HR: hazard ratio. The y axis was log-transformed for better visualization. The dose-response analysis employed the restricted cubic spline for ASMI and adjusted for the same set of covariates as the primary Cox model. Red lines represent cancer survivors and blue lines represent matched cohort. The solid lines are the fitted lines and dash lines are the 95% confidence intervals. The dotted lines are reference lines. ASMI=8.10 kg/m2 was used as the reference in the curve.
