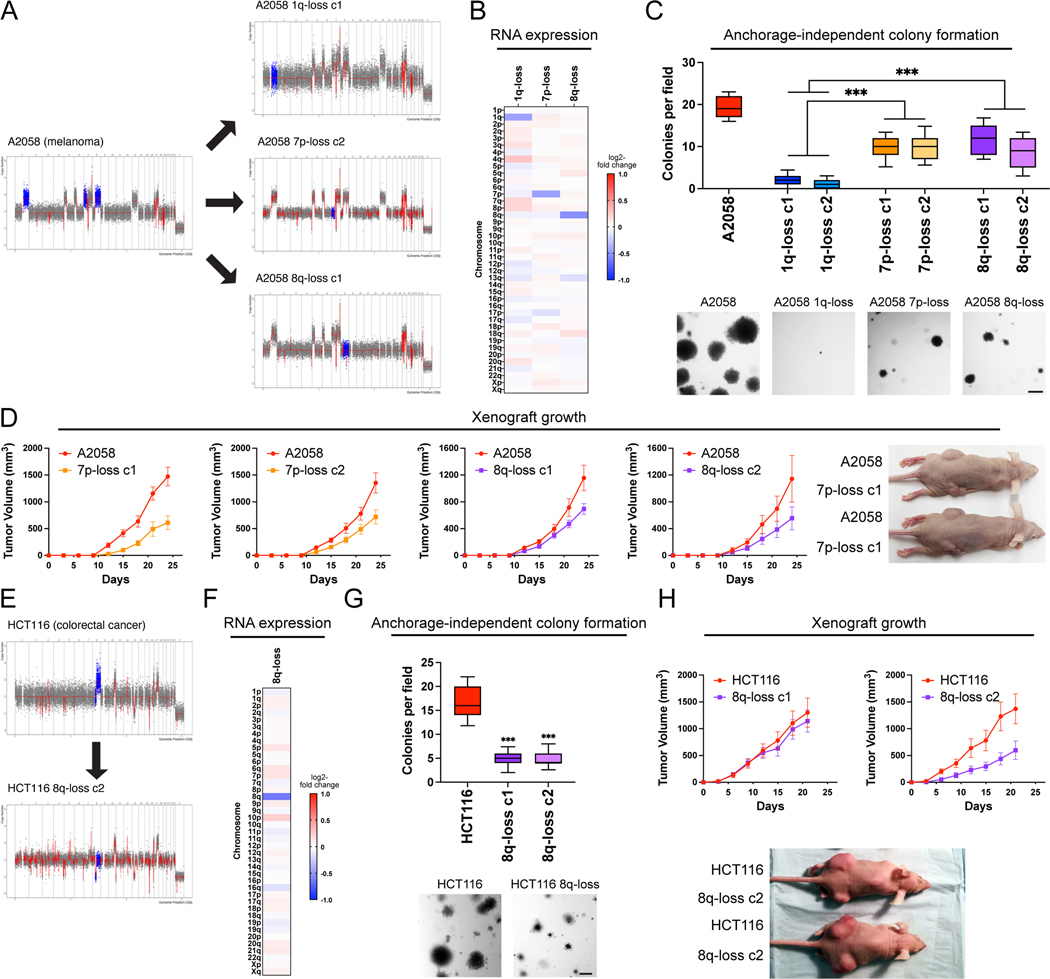
Figure 3. Variable degrees of addiction to aneuploidy of chromosome 1q, 7p, and 8q.
(A) Representative SMASH karyotypes of the 1q-disomic, 7p-disomic, and 8q-disomic clones generated from the melanoma cell line A2058. Trisomy of chromosomes 1q, 7p, and 8q are highlighted in blue in the parental cell line on the left, and the respective targeted chromosome loss is highlighted in blue in the derived clones on the right. A complete list of aneuploidy-loss clones and how they were generated is included in Table S3.
(B) 1q-disomic, 7p-disomic, and 8q-disomic clones in A2058 exhibit decreased RNA expression of genes encoded on the targeted chromosome. RNA expression data were obtained through bulk RNA-seq and represent the average expression of genes by chromosome arm across multiple aneuploidy-loss clones for each targeted chromosome. Data are log2 transformed, normalized to the parental cell line, and adjusted so that the mean expression across all chromosomes is 0.
(C) 7p-disomic and 8q-disomic clones in A2058 exhibit a milder deficit in anchorage-independent growth as compared to 1q-disomic clones. The micrographs display representative images of colony formation for the indicated cell lines.
(D) 7p-disomic and 8q-disomic clones in A2058 exhibit a moderate defect in xenograft growth. Wild-type (7p-trisomic and 8q-trisomic) cells and either 7p-disomic or 8q-disomic cells were injected contralaterally and subcutaneously into immunocompromised mice. The graphs display the mean ± SEM for each trial. Representative mice are shown on the right.
(E) SMASH karyotype of an 8q-disomic clone generated from the colorectal cancer cell line HCT116. Chromosome 8q is highlighted in blue.
(F) 8q-disomic clones in HCT116 exhibit decreased RNA expression of genes encoded on chromosome 8q. RNA expression data were obtained through bulk RNA-seq and represent the average expression of genes by chromosome arm across multiple aneuploidy-loss clones for each cell line. Data are log2 transformed, normalized to the parental cell line, and adjusted so that the mean expression across all chromosomes is 0.
(G) 8q-disomic clones in HCT116 exhibit decreased anchorage-independent growth. The micrographs display representative images of colony formation for the indicated cell lines.
(H) 8q-disomic clones in HCT116 exhibit variable xenograft growth. 8q-trisomic and 8q-disomic cells were injected contralaterally and subcutaneously into immunocompromised mice. The graphs display the mean ± SEM for each trial. Representative mice are shown below the graphs.
For anchorage-independent growth assays in C and G, boxes represent the 25th, 50th, and 75th percentiles of colonies per field, while the whiskers represent the 10th and 90th percentiles. Unpaired t-test, n = 15 fields of view, data from representative trial (n ≥ 2 total trials). Representative images are shown below. Scale bars = 250 μm.
***p < 0.0005

