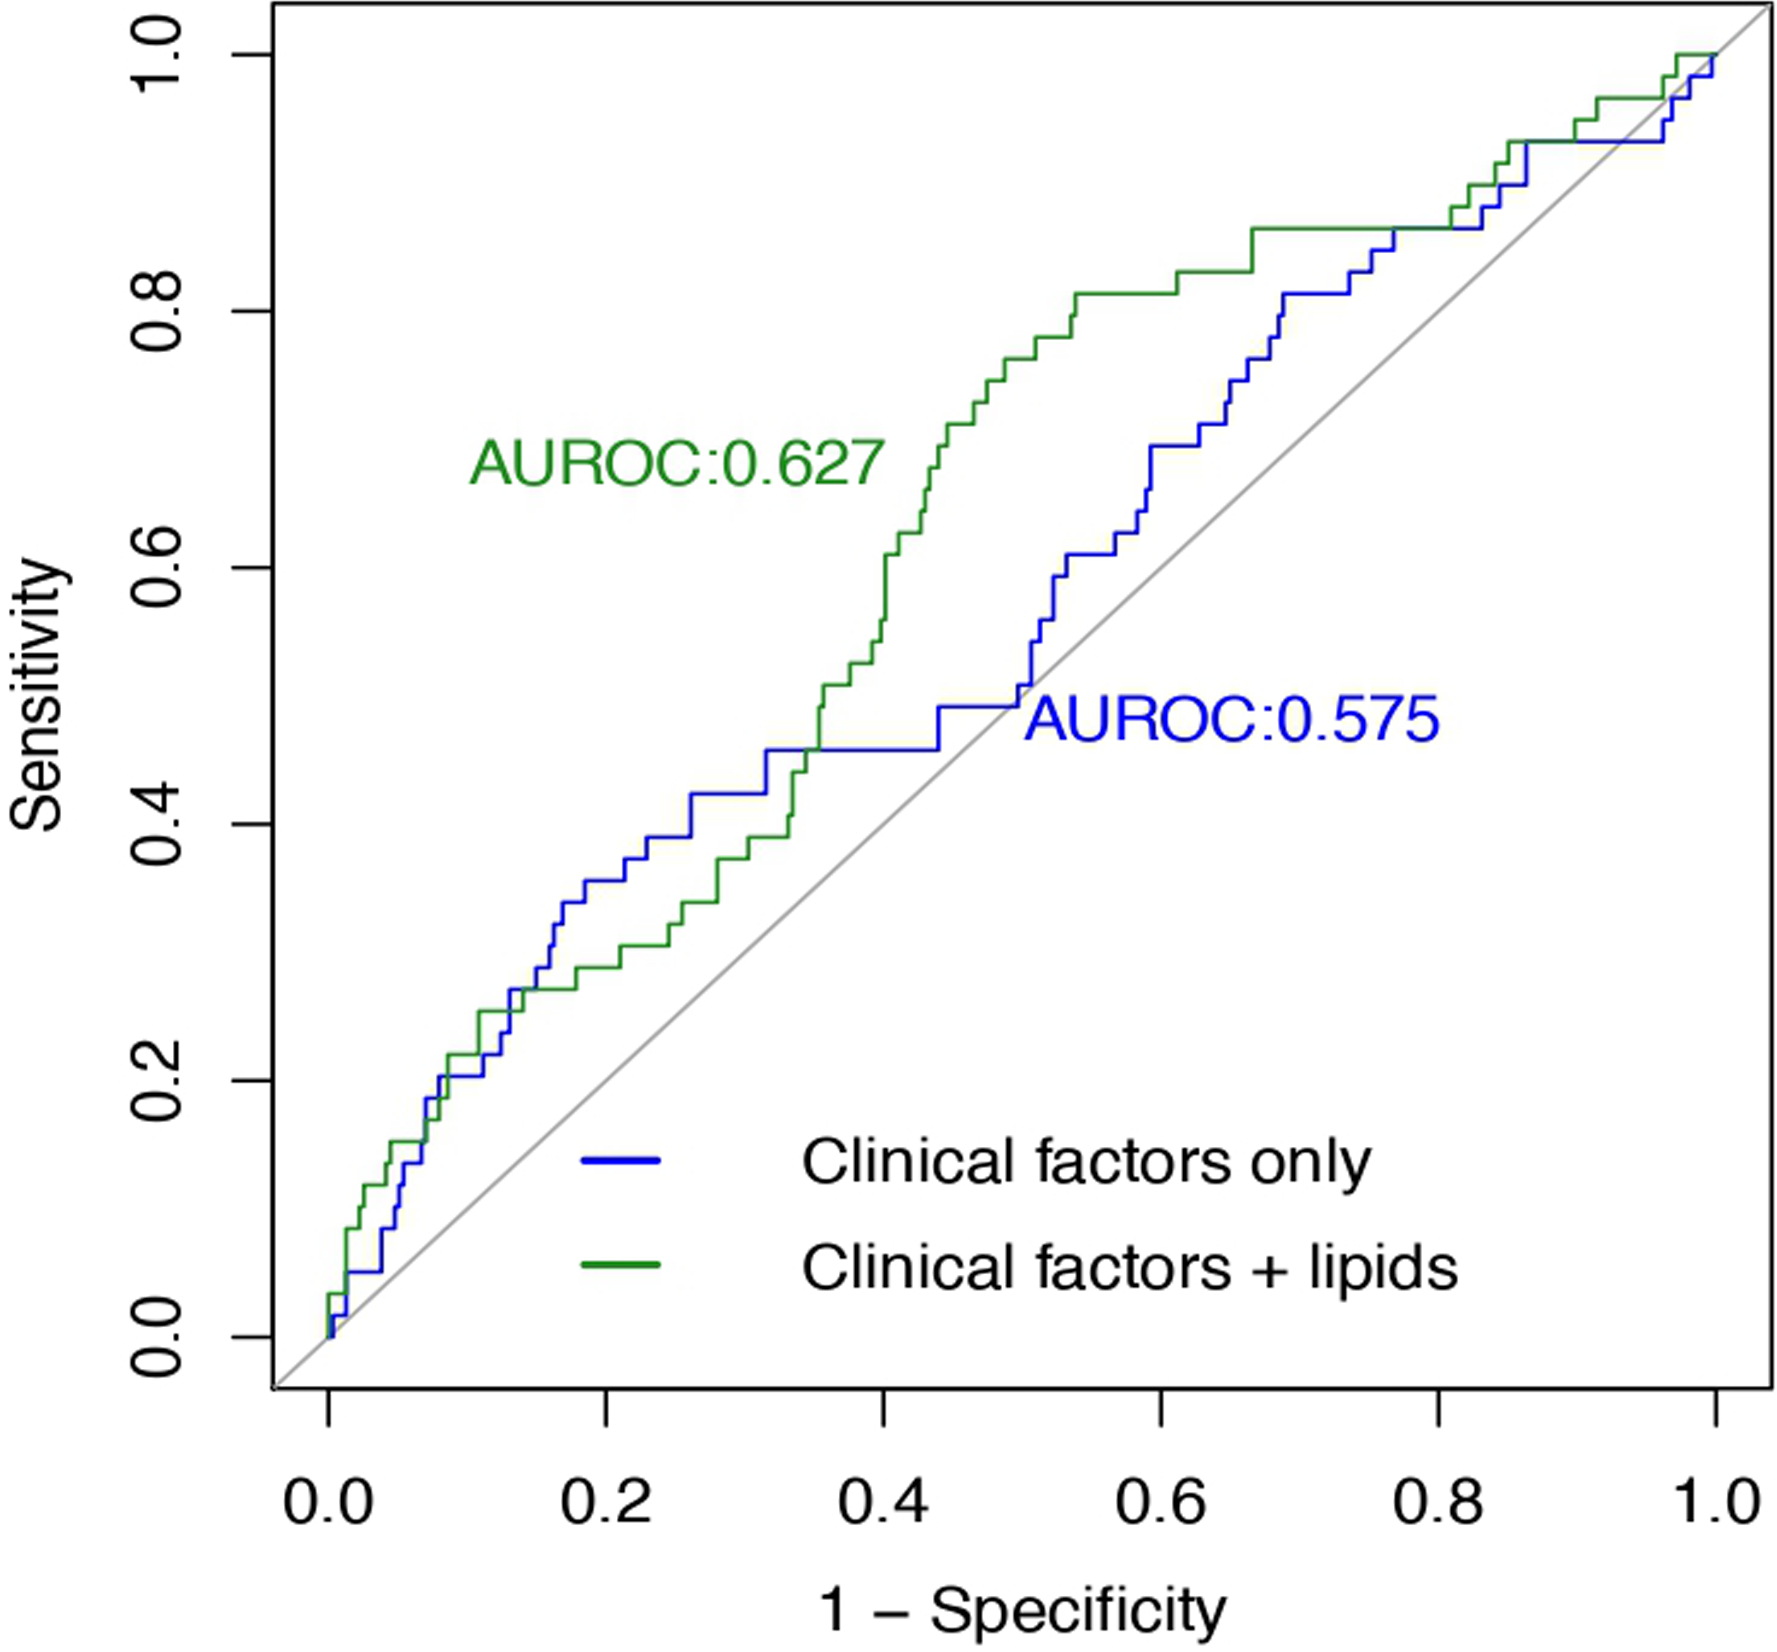
Fig. 2. Incremental value of the identified plasma lipids in risk prediction for depression.

Model 1: clinical factors only, including age, sex, study center, BMI, a composite variable indicating the presence or absence of chronic diseases (i.e., type 2 diabetes, hypertension, cardiovascular disease or chronic kidney disease), and use of alcohol, anti-depressants or lipid-lowering drugs at baseline. Model 2: clinical factors + 6 significant lipids, including SM(d36:3) A, SM(d32:2) B, SM(d40:2) B, SM(d41:2) B, SM(d39:1) B, and PC(40:6) A. Compared to the model that included clinical factors only (model 1), additional inclusion of plasma lipids (model 2) significantly increases risk prediction for depression. AUROC increases from 0.575 to 0.627 (P = 0.035); continuous NRI = 0.417, PNRI = 0.001; IDI = 0.016, PIDI = 0.001.
