
Fig. 4. Manhattan plots displaying the longitudinal associations of change in plasma lipids with change in psychosomatic measures between baseline and follow-up.
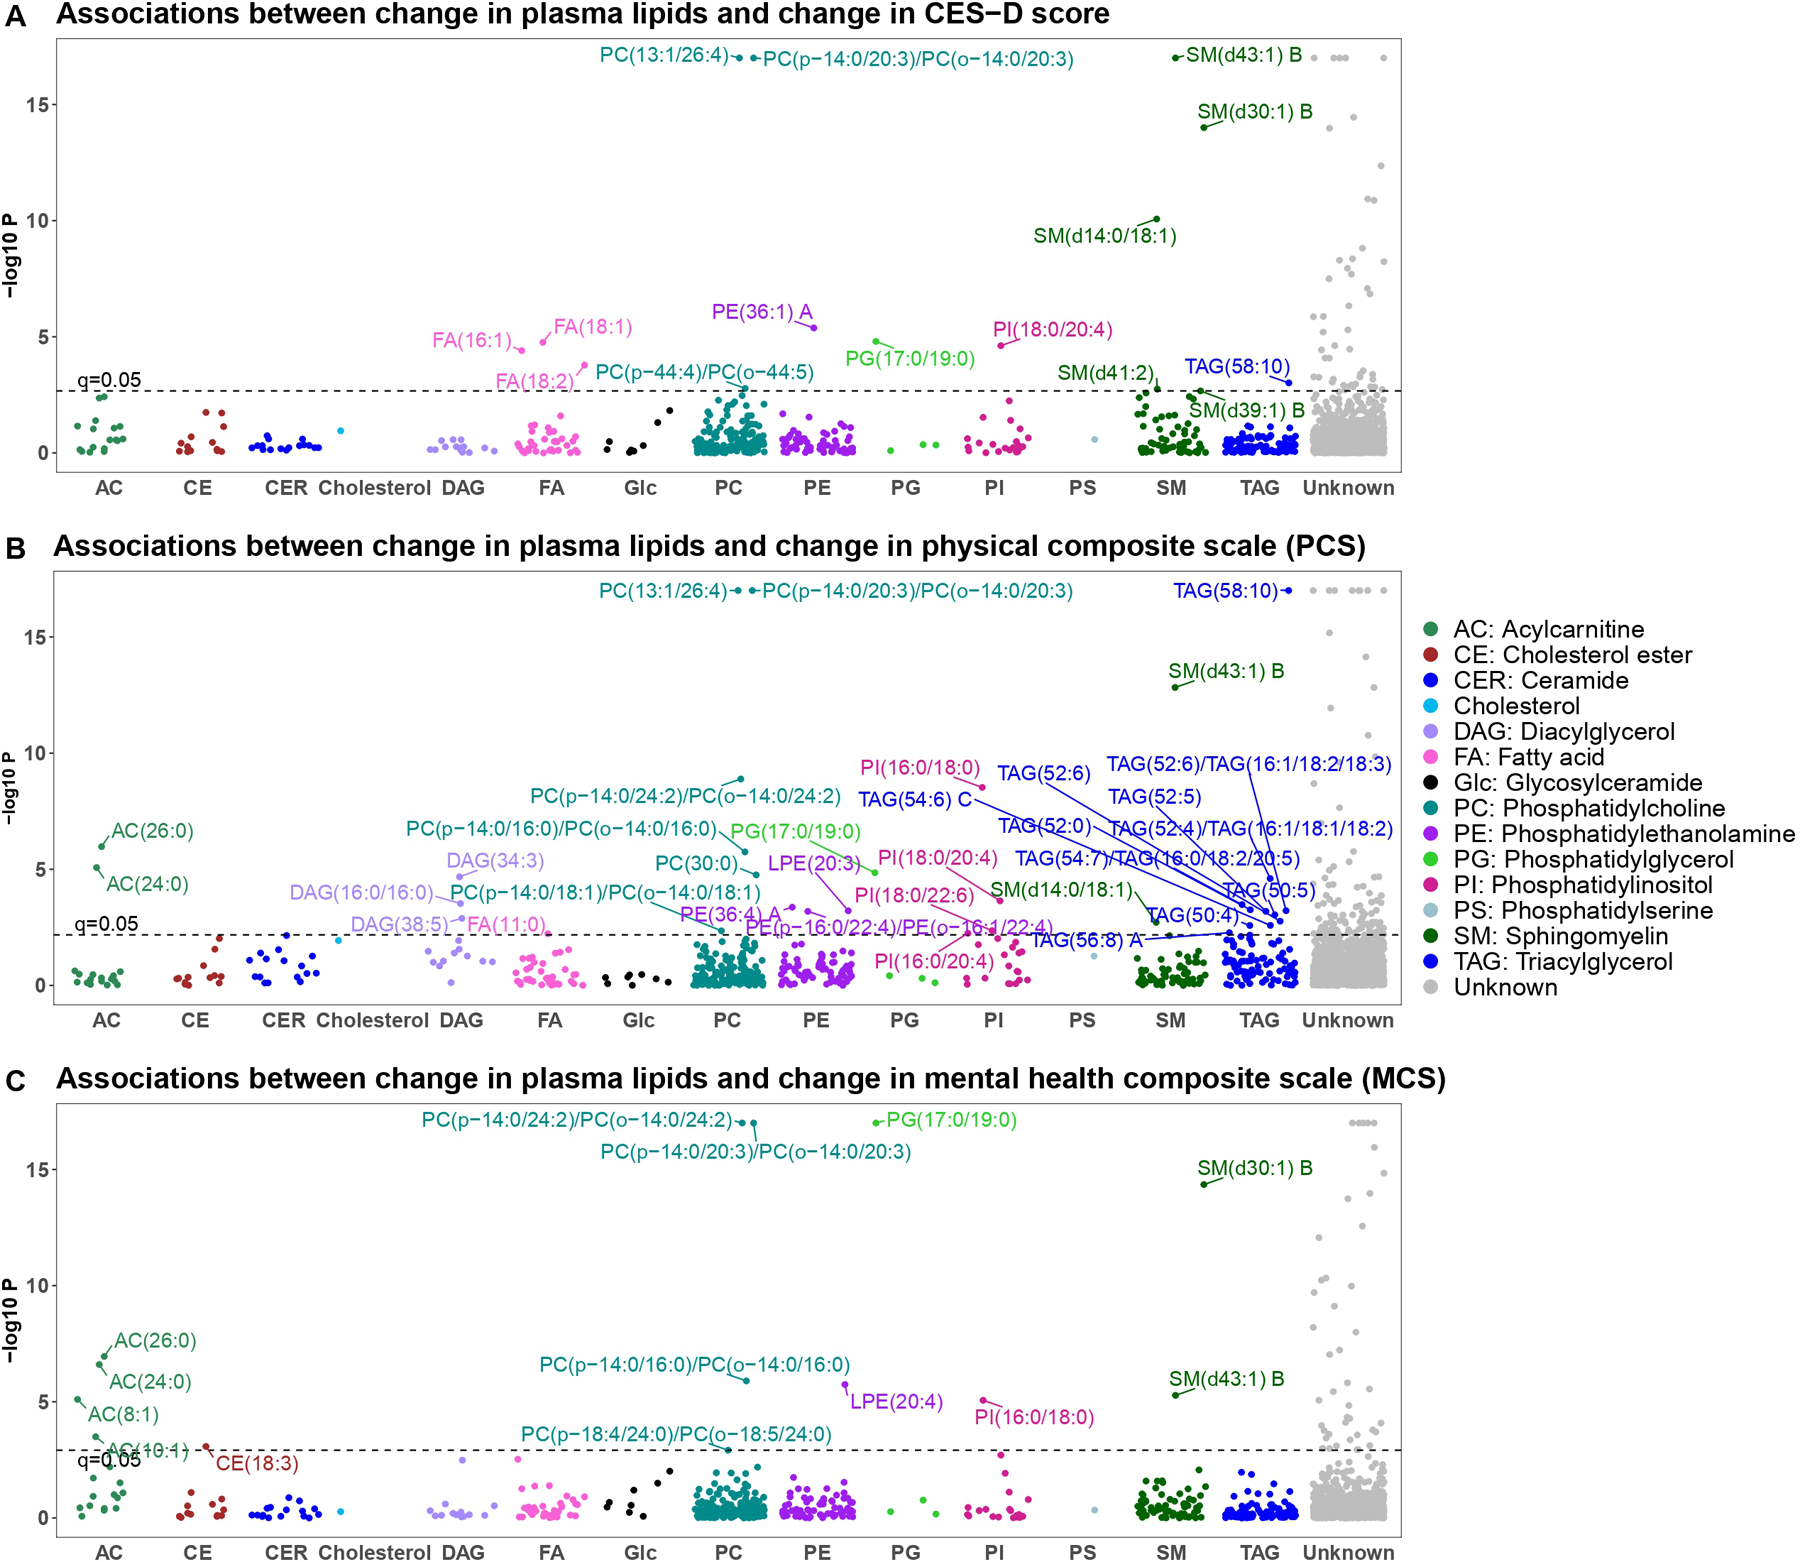
A CES-D score; B physical composite scale (PCS); C mental health composite scale (MCS). X-axis: lipid classes; Y-axis: −log10 P. Different colors represent different lipid categories. The dashed line represents significance level at q = 0.05. The letter A or B in the name of lipids represents isomers.