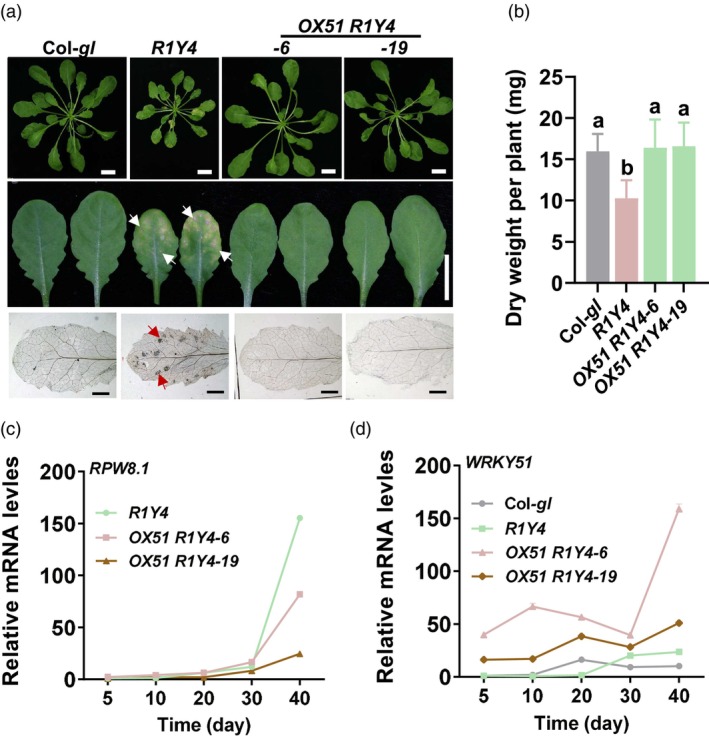
Figure 2.

WRKY51 rescues RPW8.1‐suppressed plant growth. (a) Representative five‐week‐old plants and leaves of R1Y4, OX51 R1Y4 and Col‐gl control. The white arrows indicate necrotic lesions and the red arrows indicate cell death nearby the necrotic lesions. Cell death was stained with trypan blue in the lower panel. Scale bar: 1 cm for upper and middle panels and 1 mm for the lower panel. (b) Dry weights of R1Y4, OX51 R1Y4 and Col‐gl control. Data are shown as mean ± SD (n = 6 independent samples). The letters above bars indicate significant differences at P < 0.01 determined by one‐way ANOVA followed by post hoc Tukey HSD analysis. (c‐d) Reverse‐transcription quantitative polymerase chain reaction (RT‐qPCR) show the relative mRNA levels of RPW8.1 and WRKY51 in the indicated lines during the growth period. Data are shown as mean ± SD, n = 3 independent samples.
