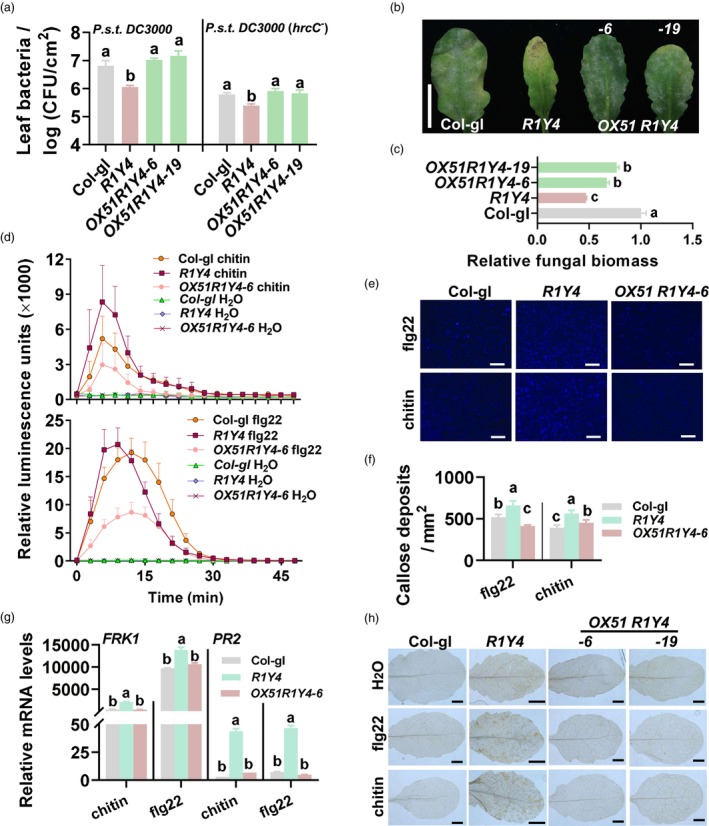
Figure 4.

WRKY51 suppresses RPW8.1‐mediated resistance and PAMPs‐triggered immune responses. (a) Bacterial growth in OX51 R1Y4 (containing 35S:WRKY51 and native promoter‐expressed RPW8.1), R1Y4 (containing native promoter‐expressed RPW8.1) and Col‐gl control 3 days post‐inoculation (dpi) with Pseudomonas syringae DC3000 or DC3000(hrcC − ). (b) Disease symptoms of indicated lines 10 dpi with powdery mildew. Scale bar = 1 cm. (c) Fungal biomass of powdery mildew from (b). Fungal biomass was examined by quantitative polymerase chain reaction (qPCR) and shown as the ratio of powdery mildew GDSL‐like lipase DNA against Arabidopsis actin2 DNA. (d) Reactive oxygen species (ROS) bursts triggered by chitin and flg22 in indicated lines. (e) Callose depositions triggered by chitin and flg22 in OX51 R1Y4, R1Y4 and Col‐gl. Callose depositions stained by aniline blue appear as bright spots. Scale bars = 0.1 mm. (f) Quantitation of callose depositions in (f). (g) Reverse‐transcription qPCR (RT‐qPCR) show the relative mRNA levels of FRK1 and PR2 in indicated lines (3 h post‐treatment (hpt) for FRK1 and 12 hpt for PR2) treated with chitin or flg22. Data were normalized to that of Col‐gl at 0 hpt. (h) H2O2 accumulation in indicated lines 48 hpt with or without chitin or flg22 treatment. 3, 3‐diaminobezidin (DAB) was used to stain H2O2 (reddish‐brown). Scale bar = 1 mm. For a–h, data are shown as mean ± SD (n = 3 independent samples for c and h; n = 4 for a, d and e; n = 6 for g). The letters above bars indicate significant differences at P < 0.01 determined by one‐way ANOVA followed by post hoc Tukey HSD analysis.
