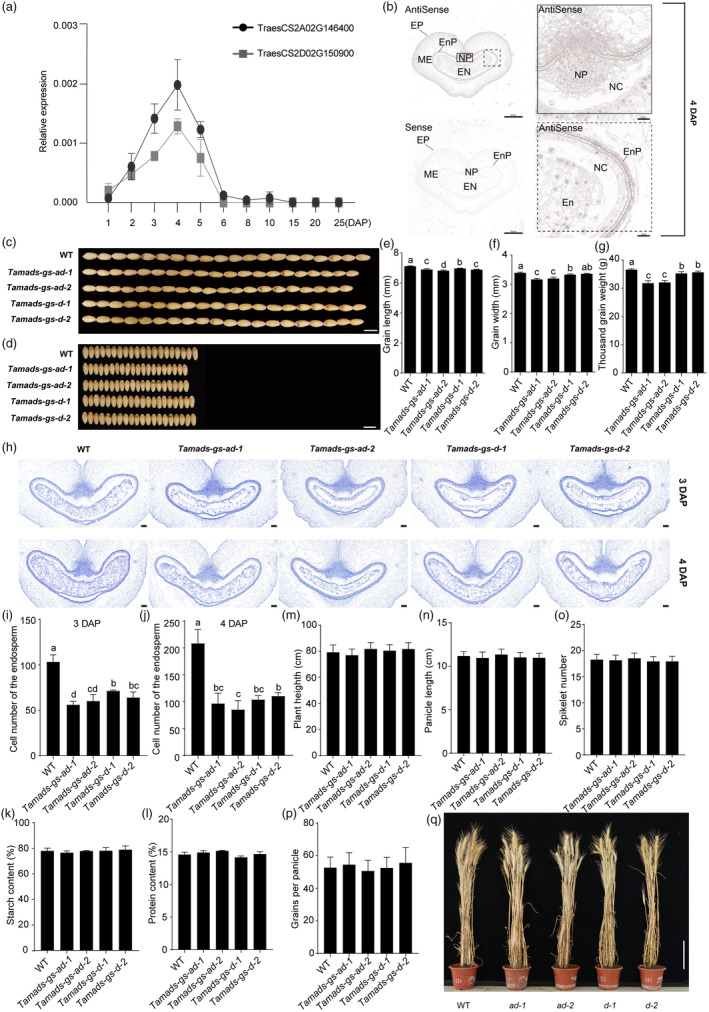
Figure 1.

TaMADS‐GS expression in wheat seeds and phenotypes of wheat Tamads‐gs knockout lines. (a) Relative transcript levels of the two TaMADS‐GS homoeologs in the developing seeds at indicated days after pollination (DAP), as determined by RT‐qPCR. Data were normalized to wheat TaACTIN and reported as average value ± SD. (b) Representative picture of in situ hybridization assays performed using 4‐DAP seed and hybridized with antisense and sense TaMADS‐GS‐D transcript probes. EP, exocarp; ME, mesocarp; Enp, endocarp; NP, nucellar projection; NC, nucellar; En, endosperm. Scale bar in left and right sides of the panel represents 500 μm and 50 μm, respectively. (c–g) Grain width, grain length, and thousand‐grain weight measured in WT and Tamads‐gs knockout mutants. In c and d, the bar is 7 mm. Ten biological replicates were used for analysis, each with approximately 20 g seeds. Different letters above the graph bar indicate a statistically significant difference (P < 0.05) between different genotypes, while the presence of the same letter indicates the absence of statistically significant difference. (h) Representative cross sections of 3‐ and 4‐DAP seeds of the indicated genotypes. En, endosperm. Scale bar represents 100 μm. (i and j) The cell number of the endosperm in WT and Tamads‐gs knockout mutants. (k and l) The starch and protein content between WT and Tamads‐gs knockout mutants. (m–p) Plant height, panicle length, spikelet number and grains per panicle were measured in WT and Tamads‐gs knockout mutants. (q) Mature plants of WT and Tamads‐gs mutants. Scale bar, 16 cm. A total of 30 plants were selected to analyse plant height, panicle length, spikelet number and grains per panicle.
