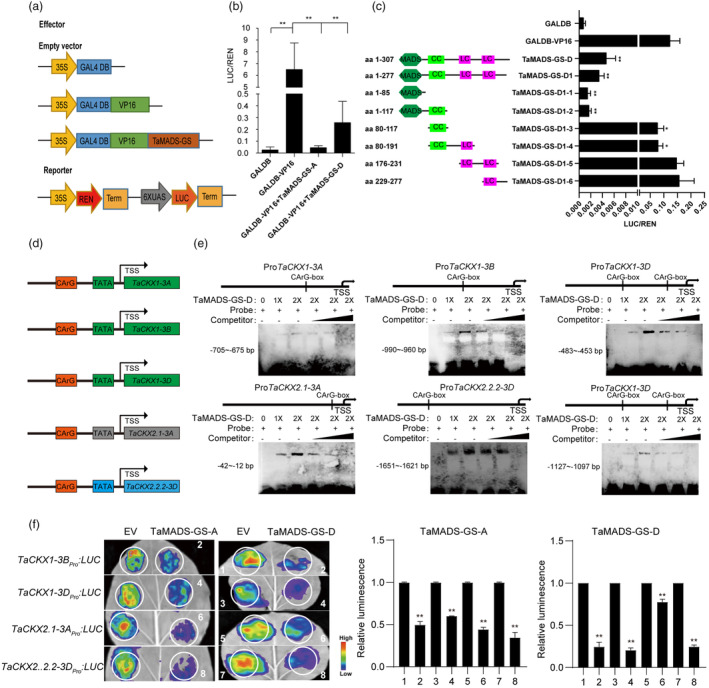
Figure 3.

TaMADS‐GS protein represses transcription of specific TaCKX genes. (a) Schematization of constructs used for the dual‐luciferase transient activity assay. The 35S constitutive promoter of the Cauliflower mosaic virus in the reporter construct drives the expression of the Renilla luciferase (REN) gene and the REN signal was used as the control to measure the firefly luciferase (LUC)/Renilla luciferase (REN) ratio. (b) TaMADS‐GS acts as a transcriptional repressor, as determined by dual‐luciferase transient activity assay. Luciferase activity was strongly repressed by the GAL4DB‐VP16‐TaMADS‐GS‐D fusion protein compared to GAL4DB‐VP16. Average values of LUC/REN ratio ± SD (n = 10) are reported. The double asterisks indicate a significant difference determined by Student's t‐test at P < 0.01. (c) Transient transcriptional assays of the TaMADS‐GS‐D deletions schematized. The double asterisks indicate a significant difference determined by Student's t‐test at P < 0.01. (d) The CArG motif was found in the putative promoter of TaCKX genes. (e) Representative images of results achieved with EMSA assays. “+” indicates the addition the biotin‐labelled probe at different concentrations (1X or 2X). Unlabeled probe was used as competitor. (f) Representative image (left panel) and quantitative results (right panel) of the transient transcriptional assays. Heat scale from blue to red is reported and represent the measured LUC signal. Red means strong activation, and blue means weak activation. Average values ± SD (n = 3) are reported. The LUC signal detected when the reporter construct was co‐transformed with a construct expressing the GFP alone was set to 1, while the relative LUC value with respect to the reporter + GFP alone was calculated when the reporter construct was co‐transformed with the construct expressing the TaMADS‐GS‐D protein fused to GFP. The asterisk represents statistically significant differences compared between 1 and 2, 3 and 4, 5 and 6, 7 and 8, as determined by Student's t‐test at P < 0.01.
