
FIGURE 2.
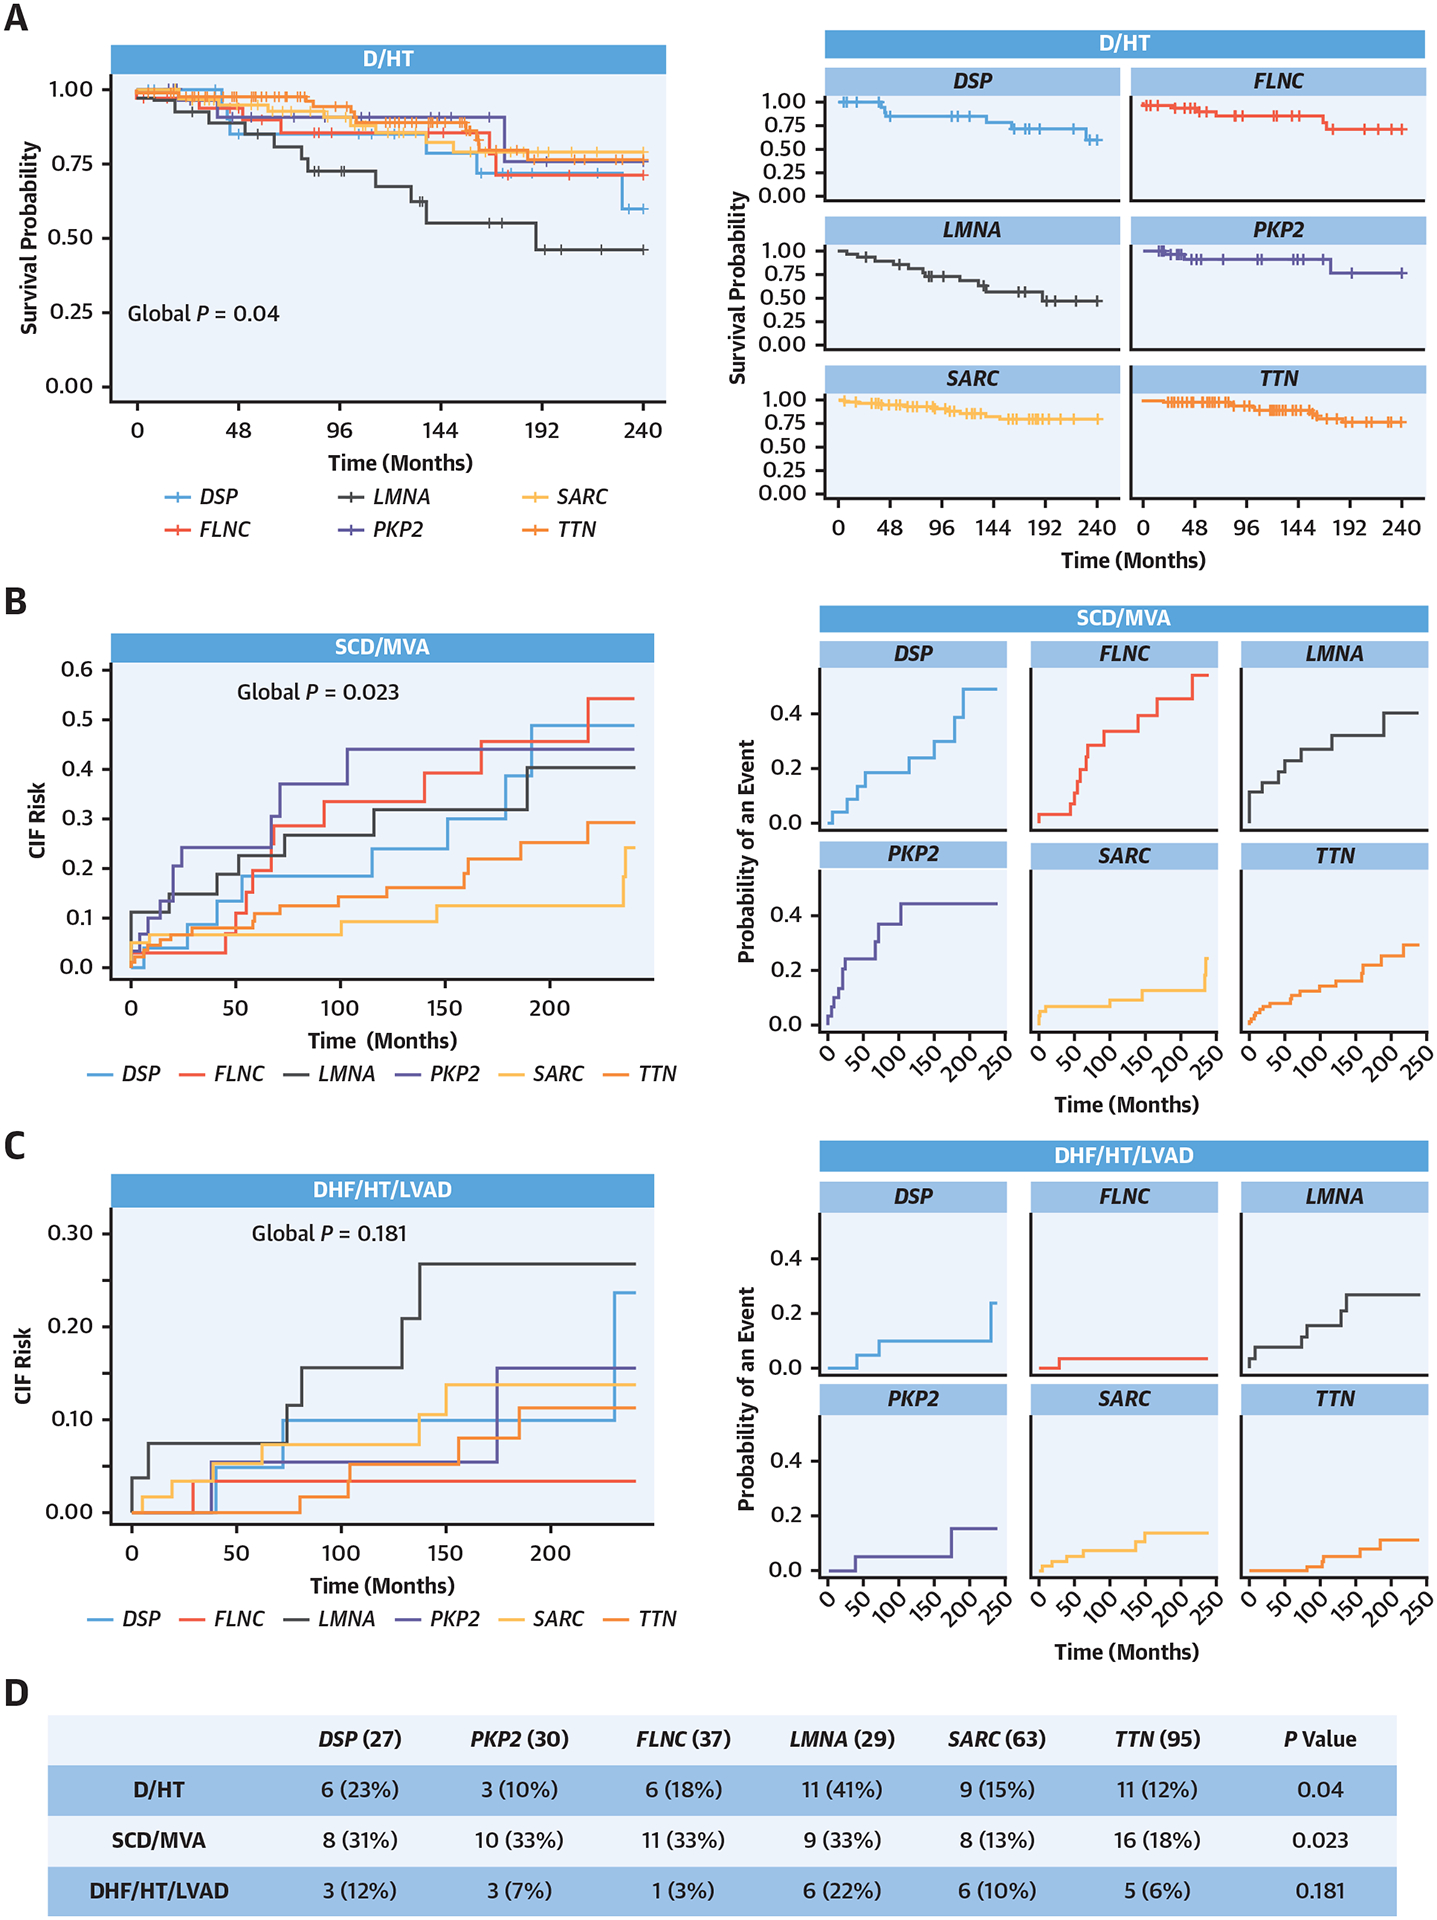
Survival Analysis of the Study Population Based on Genotype
Gene-specific survival curves for each outcome, showing LMNA carriers at the highest risk of D/HT and DSP, PKP2, FLNC, and LMNA with higher and comparable sudden cardiac death (SCD)/major ventricular arrhythmia (MVA) risks. (A) (Left) Kaplan-Meier curves for D/HT endpoint. (Right) The same curves split singularly for each gene/gene group. (B) CIF curves for the SCD/MVA endpoint. (Right) The same curves split singularly for each gene/gene group. (C) CIF curves for the DHF/HT/LVAD endpoint. (Right) The same curves split singularly for each gene/gene group. (D) Table reporting the counts of each endpoint for each gene/gene group. D = all-cause mortality; DHF = heart failure-related death; CIF = cumulative incident fraction; HT = heart transplantation; LVAD = left ventricular assist device; other abbreviations as in Figure 1.