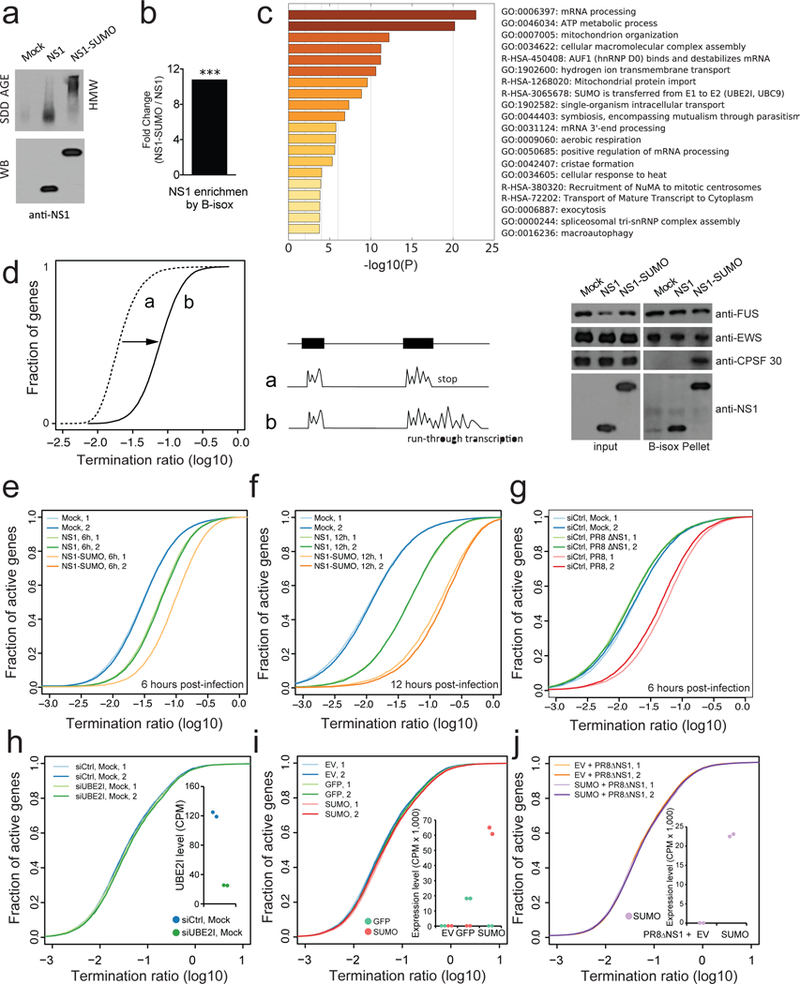
Fig. 3. SUMOylation of NS1 induces oligomeric assembly and increases pervasive RNAPII termination defects at host transcripts.

a, SDD-AGE (top) and WB (bottom) analysis on NS1 and NS1-SUMO virus infected lysates of A549. Mock: uninfected control. b, B-isox enrichment of NS1 from A549 lysate infected by NS1 and NS1-SUMO virus as analyzed by mass-spectrometry. ***, p value: 1.98*10−3. c, GO enrichment analysis of biological processes of B-isox enriched proteins during NS1 and NS1-SUMO infection (left panel), WB of the input and B-isox precipitates from NS1 and NS1-SUMO virus infected A549 lysates by the indicated antibodies (right panel). FUS and EWS are controls for resident RNA granule proteins. d, Schematic of the approach used to detect a relative increase in transcript levels in 3’ end gene-flanking regions. For each gene, a 3-prime transcript ratio (Termination ratio, TR) was calculated as the average number of total RNA-Seq reads per bp in 5-kilobase 3’ gene-flanking regions, divided by that in exonic regions. A global relative increase in 3’ transcript levels results in a horizontal transformation of the cumulative TR plot, as indicated. e-f, TR plots at termination region of active genes (RPKM > 1 in 50% of samples) in uninfected A549 cells and 6 hpi (e) or 12 hpi (f) with NS1 or NS1-SUMO virus. Data is shown for two replicates in each condition (n=2). g, TR plots at termination region of active genes (RPKM > 1 in 50% of samples) in uninfected A549 cells and 6 hpi with PR8 or ∆NS1 virus. Data is shown for two replicates in each condition. h-j, TR plots at termination region of uninfected A549 cells depleted for Ubiquitin Conjugating Enzyme E2 (siUBE2I) and control (siCtrl) (h), transfected with either empty vector (EV), or a vector expressing GFP or SUMO (i), and infected with PR8ΔNS1 A459 cells transfected with an empty vector (EV) or a vector expressing SUMO (j). The insets show the RNA expression levels of UBE2I in siCtrl or siUBE2I treated cells (h) and of GFP and/or SUMO in each condition (i-j) as counts per million sequenced reads (CPM). Results are shown for two biological replicates.
