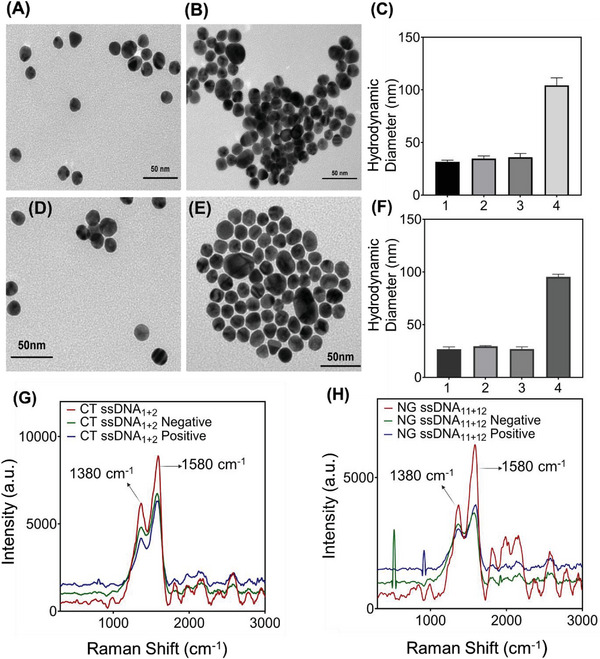
Figure 3.

Transmission electron microscopy (TEM), Dynamic Light Scattering (DLS) and Raman spectroscopy data for CT targeted AuNP‐ssDNAs (A‐C &G) and NG targeted AuNP‐ssDNAs (D‐F &H). (A) ssDNA‐capped AuNPs targeted toward CT are individually dispersed with no visible aggregation in absence of CT DNA. (B) Visible aggregation of ssDNA‐capped AuNPs in presence of CT genomic DNA (0.5 ng µL−1). (C) Comparative changes in average hydrodynamic diameter of the ssDNA capped AuNP targeted toward CT (1. AuNP 2. ssDNA capped AuNP targeted toward CT, 3. ssDNA capped AuNP targeted toward CT in presence of NG and 4. ssDNA capped AuNP targeted toward CT in presence of CT). Data are presented as mean ± SD. Error bar indicates the measurements of the hydrodynamic diameter from three (n = 3) such independent experiments. (D) ssDNA‐capped AuNPs targeted toward NG are individually dispersed with no visible aggregation in absence of NG DNA. (E) Visible aggregation of ssDNA‐capped AuNPs in presence of NG genomic DNA (0.5 ng µL−1). (F) Comparative changes in average hydrodynamic diameter of the ssDNA capped AuNP targeted toward NG (1. AuNP 2. ssDNA capped AuNP targeted toward NG, 3. ssDNA capped AuNP targeted toward NG in presence of CT and 4. ssDNA capped AuNP targeted toward NG in presence of NG). Data are presented as mean ± SD. Error bar indicates the measurements of the hydrodynamic diameter from three (n = 3) such independent experiments. (G) Raman spectra for CT targeted AuNP‐ssDNAs in presence of CT genomic DNA (0.5 ng µL−1). (H) Raman spectra for NG targeted AuNP‐ssDNAs in presence of NG genomic DNA (0.5 ng µL−1).
