Figure 4.

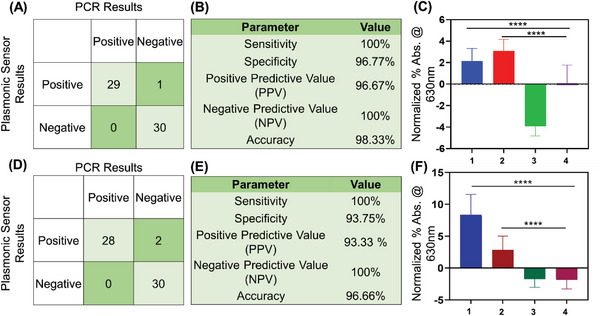
Chlamydia and Gonorrhea detection from sixty (n = 60) deidentified clinical samples. (A) Confusion matrix obtained from the demonstrated CT DNA targeting ssDNA conjugated AuNP based test. Results were benchmarked with the gold standard technique qPCR for the sixty (n = 60) deidentified clinical samples. (B) CT DNA targeting ssDNA conjugated AuNP based test parameters indicating the sensitivity, specificity, PPV, NPV and accuracy (n = 60). (C) Graphical representation of normalized percentage (%) absorbance change at 630 nm for the CT DNA targeted ssDNA conjugated AuNP based test. 1 is CT+ sample (n = 15); 2 is both CT+NG+ sample (n = 15); 3 is NG+ sample (n = 15) and 4 is both CT‐NG‐ samples(n = 15). Data are presented as mean ± SD. The one‐way ANOVA showed that the assay response was significantly different between positives and negatives. ****p‐value <0.0001 (D) Confusion matrix obtained from the NG DNA targeting ssDNA conjugated AuNP based test. Results were benchmarked with the gold standard technique qPCR from sixty (n = 60) deidentified clinical samples. (E) NG DNA targeted ssDNA conjugated AuNP based test parameters indicating the sensitivity, specificity, PPV, NPV and accuracy (n = 60). (F) Graphical representation of normalized percentage (%) absorbance change at 630 nm for NG DNA targeting ssDNA conjugated AuNP based test. 1 is NG+ sample (n = 15); 2 is both CT+NG+ sample (n = 15); 3 is CT+ sample (n = 15) and 4 is both CT‐NG‐ samples (n = 15). The one‐way ANOVA showed that the assay response was significantly different between positives and negatives. ****p‐value <0.0001.
