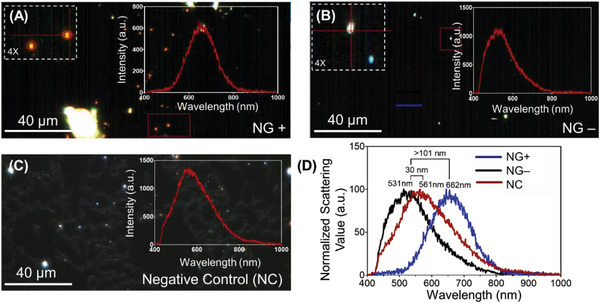
Figure 6.

The hyperspectral imaging of the ssDNA‐AuNPs targeted toward NG in the presence of (A) NG+ (Ct = 27), (B) CT+ and NG‐ (Ct = 32) and (C) NG‐ samples. (D) The hyperspectral signature was collected as a response to NG+, CT+ and NG‐, and NG‐ samples from multiple positions of the image has been represented. The brackets show the distance between the peak maxima between the spectra obtained before and after the addition of the target DNA. The experiments were performed with experimental repeats of n = 5.
