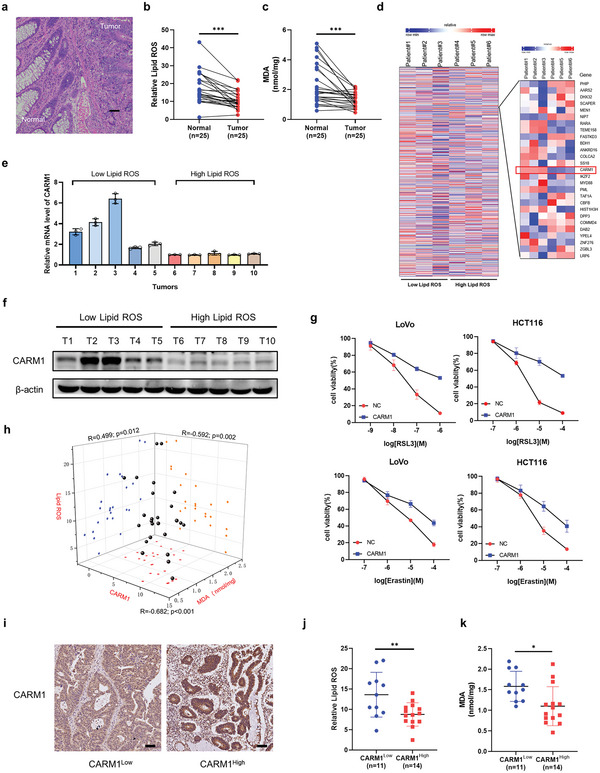
Figure 1.

CARM1 was negatively associated with ferroptosis. a) HE staining of clinical specimens of colon cancer. Scale bar, 20 µm. b) Twenty‐five pairs of colorectal cancer (CRC) tissues and adjacent tissues were digested into single‐cell suspensions, and lipid ROS production was assayed via flow cytometry by using C11‐BODIPY after RSL3 treatment for 4 h (n = 25). c) Malondialdehyde (MDA) levels were detected by using a lipid peroxidation MDA assay kit in single‐cell suspensions treated with RSL3 for 4 h from 25 pairs of CRC tissues and adjacent tissues (n = 25). d) Heatmap of RNA‐seq using six patient tumors with different lipid ROS levels showing changes in gene expression, including CARM1. e) Quantitative real‐time PCR (qPCR) analysis of CARM1 mRNA levels in tumors from 10 patients. f) Western blot analysis of CARM1 in the same tissues as (e). g) Cell viability was assayed in vector‐ and CARM1‐overexpressing LoVo and HCT116 cells treated with the indicated doses of RSL3 and erastin for 24 h. h) Scatter plot of the immunohistochemistry (IHC) staining score for CARM1, lipid ROS, and MDA levels in CRC tissues (n = 25). All p values and R values were calculated with Spearman's r test. i) Representative results of immunohistochemical staining for CARM1 from 25 clinical CRC patients. Scale bars, 20 µm. j,k) Lipid ROS (left) and MDA (right) levels were compared in CARM1 high (CARM1 IHC score ≥ 6) and CARM1 low (CARM1 IHC score<6) groups. The data shown represent the mean ± SD. In (b) and (c), comparisons were made by using paired Student's t‐test, and in (j) and (k), comparisons were made by using the two‐tailed, unpaired Student's t‐test; * p < 0.05, ** p < 0.01, *** p < 0.001.
