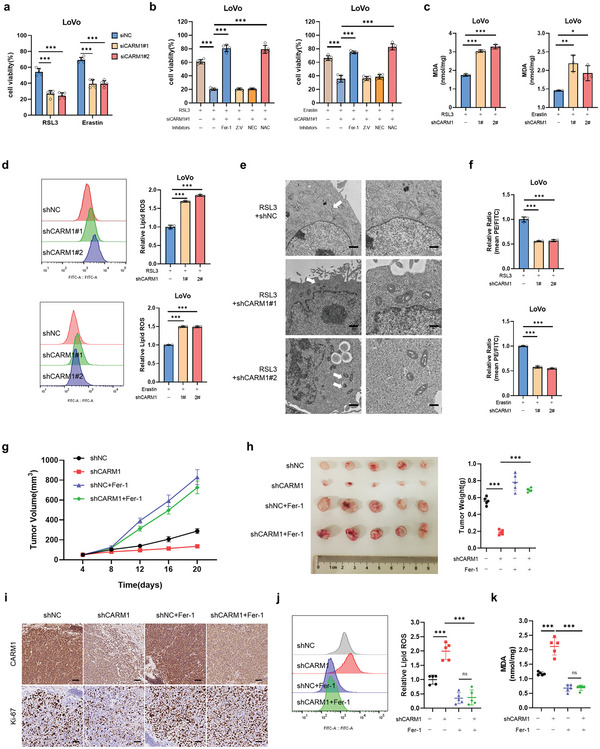
Figure 2.

CARM1‐KD enhances ferroptotic cell death. a) Cell viability was measured in siNC and siCARM1 LoVo cells treated with 2.5 × 10⁻⁶ m RSL3 or 5 × 10⁻⁶ m erastin for 12 h (n = 5 independent experiments). b) Cell viability was measured in siNC and siCARM1 LoVo cells treated with cell death inhibitors and 2. 5 × 10⁻⁶ m RSL3 or 5 × 10⁻⁶ m erastin for 12 h. Fer‐1, 1 × 10⁻⁶ m ferrostatin‐1; NAC, 5 × 10⁻³ m; Nec, 2 × 10⁻⁶ m necrostatin‐1; Z‐V, 20 × 10−6 m Z‐VAD‐FMK (n = 5 independent experiments). c,d) Malondialdehyde (MDA) levels and relative lipid ROS were assayed in the indicated LoVo cells treated with 2. 5 × 10⁻⁶ m RSL3 or 5 × 10⁻⁶ m erastin for 12 h (n = 3 independent experiments). e) Transmission electron microscopy (TEM) images of the indicated LoVo cells subjected to RSL3 (2. 5 × 10⁻⁶ m) for 12 h. White arrows indicate mitochondria. Scale bars, left, 2 µm; right, 500 nm. f) The indicated stable LoVo cells were used to evaluate mitochondrial membrane potential via fluorescence staining of mitochondria with JC‐1 dye (n = 3 independent experiments). g) shNC and shCARM1 LoVo cells were subcutaneously injected into the mice. RSL3 was administered to all tumors with or without Fer‐1. Tumor volumes (n = 5) were calculated every 4 days, and the growth curve was drawn. h) Images of tumors from LoVo xenograft mice with altered treatments are shown, and the tumor weights (n = 5) of the subcutaneous xenografts were measured. i) Representative immunohistochemical images of CARM1 and Ki67 in tumor sections are shown. Scale bars, 20 µm. j,k) MDA levels and relative lipid ROS in tumor cells isolated from (h) were assayed (n = 5 independent experiments). The data shown represent the mean ± SD. Comparisons were made by using one‐way ANOVA with Tukey's test; * p < 0.05, ** p < 0.01, *** p < 0.001.
