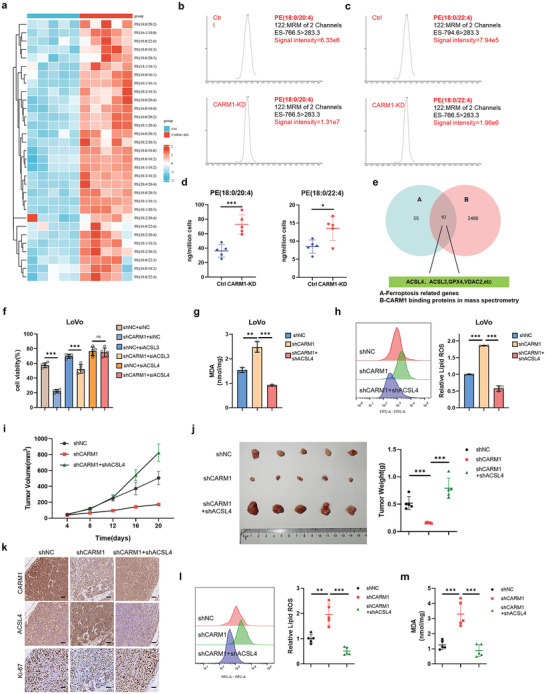
Figure 3.

The ferroptosis function of CARM1 is mediated by ACSL4. a) Heatmap of all of the major phosphatidylethanolamine (PE) species in Ctrl and CARM1‐KD LoVo cells. Each PE species was normalized to the corresponding mean value. b,c) Representative EIC images of Ctrl and CARM1‐KD LoVo cells on two major molecular species of PE (PE [18:0/20:4] and PE [18:0/22:4]), representing substrates for oxygenation during ferroptosis. d) The contents of PE (18:0/20:4) and PE (18:0/22:4) in Ctrl and CARM1‐KD LoVo cells via LC‒MS (n = 5 independent experiments). e) Screening strategy for predicting the possible substrate of CARM1 in ferroptosis. f) Cell viability was assayed in the indicated LoVo cells treated with 2. 5 × 10⁻⁶ m RSL3 for 12 h (n = 5 independent experiments). g,h) Malondialdehyde (MDA) levels and relative lipid ROS were assayed in the indicated LoVo cells treated with 2. 5 × 10⁻⁶ m RSL3 for 12 h (n = 3 independent experiments). i) The indicated stable LoVo cells were subcutaneously injected into the mice, and RSL3 was injected intratumorally (100 mg kg−1, twice per week). Tumor volumes (n = 5) were calculated every 4 days, and the growth curve was drawn. j) Images of tumors from LoVo xenograft mice with altered treatments are shown, and the tumor weights (n = 5) of the subcutaneous xenografts were measured. k) Representative immunohistochemical images of CARM1, ACSL4, and Ki67 in tumor sections are shown. Scale bars, 20 µm. l,m) MDA levels and relative lipid ROS in tumor cells isolated from (j) were assayed (n = 5 independent experiments). The data shown represent the mean ± SD. In (d), comparisons were made by using the two‐tailed, unpaired Student's t‐test; All other comparisons were made by using one‐way ANOVA with Tukey's test; * p < 0.05, ** p < 0.01, *** p < 0.001; n.s., no significant difference.
