
Fig. 1.
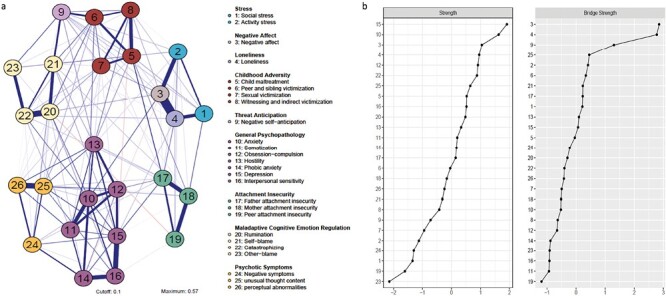
(a) Network model of childhood adversity, psychotic experiences, and potential psychological processes. Each node displays a variable, with variables in the same domain plotted by the same color. Each edge corresponds to a partial correlation between 2 nodes, the thicker the edge, the stronger the connection. Blue edges display positive connections and red edges display negative ones. (b) Centrality indices of the network: strength centrality (left) and bridge strength centrality (right). Variables are shown as standardized z-scores and sorted in decreasing order.