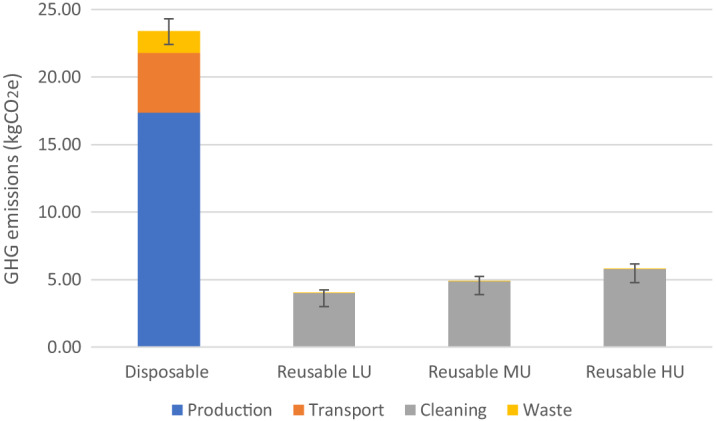
Figure 2.

Greenhouse gas emissions per day of use by oximeter type.
kgCO 2, kilograms of carbon dioxide; LU, low-use cleaning scenario (n = 387); MU, moderate-use cleaning scenario (n = 474); HU, high-use cleaning scenario (n = 561). Error bars represent a 95% confidence interval from Monte Carlo analysis.
