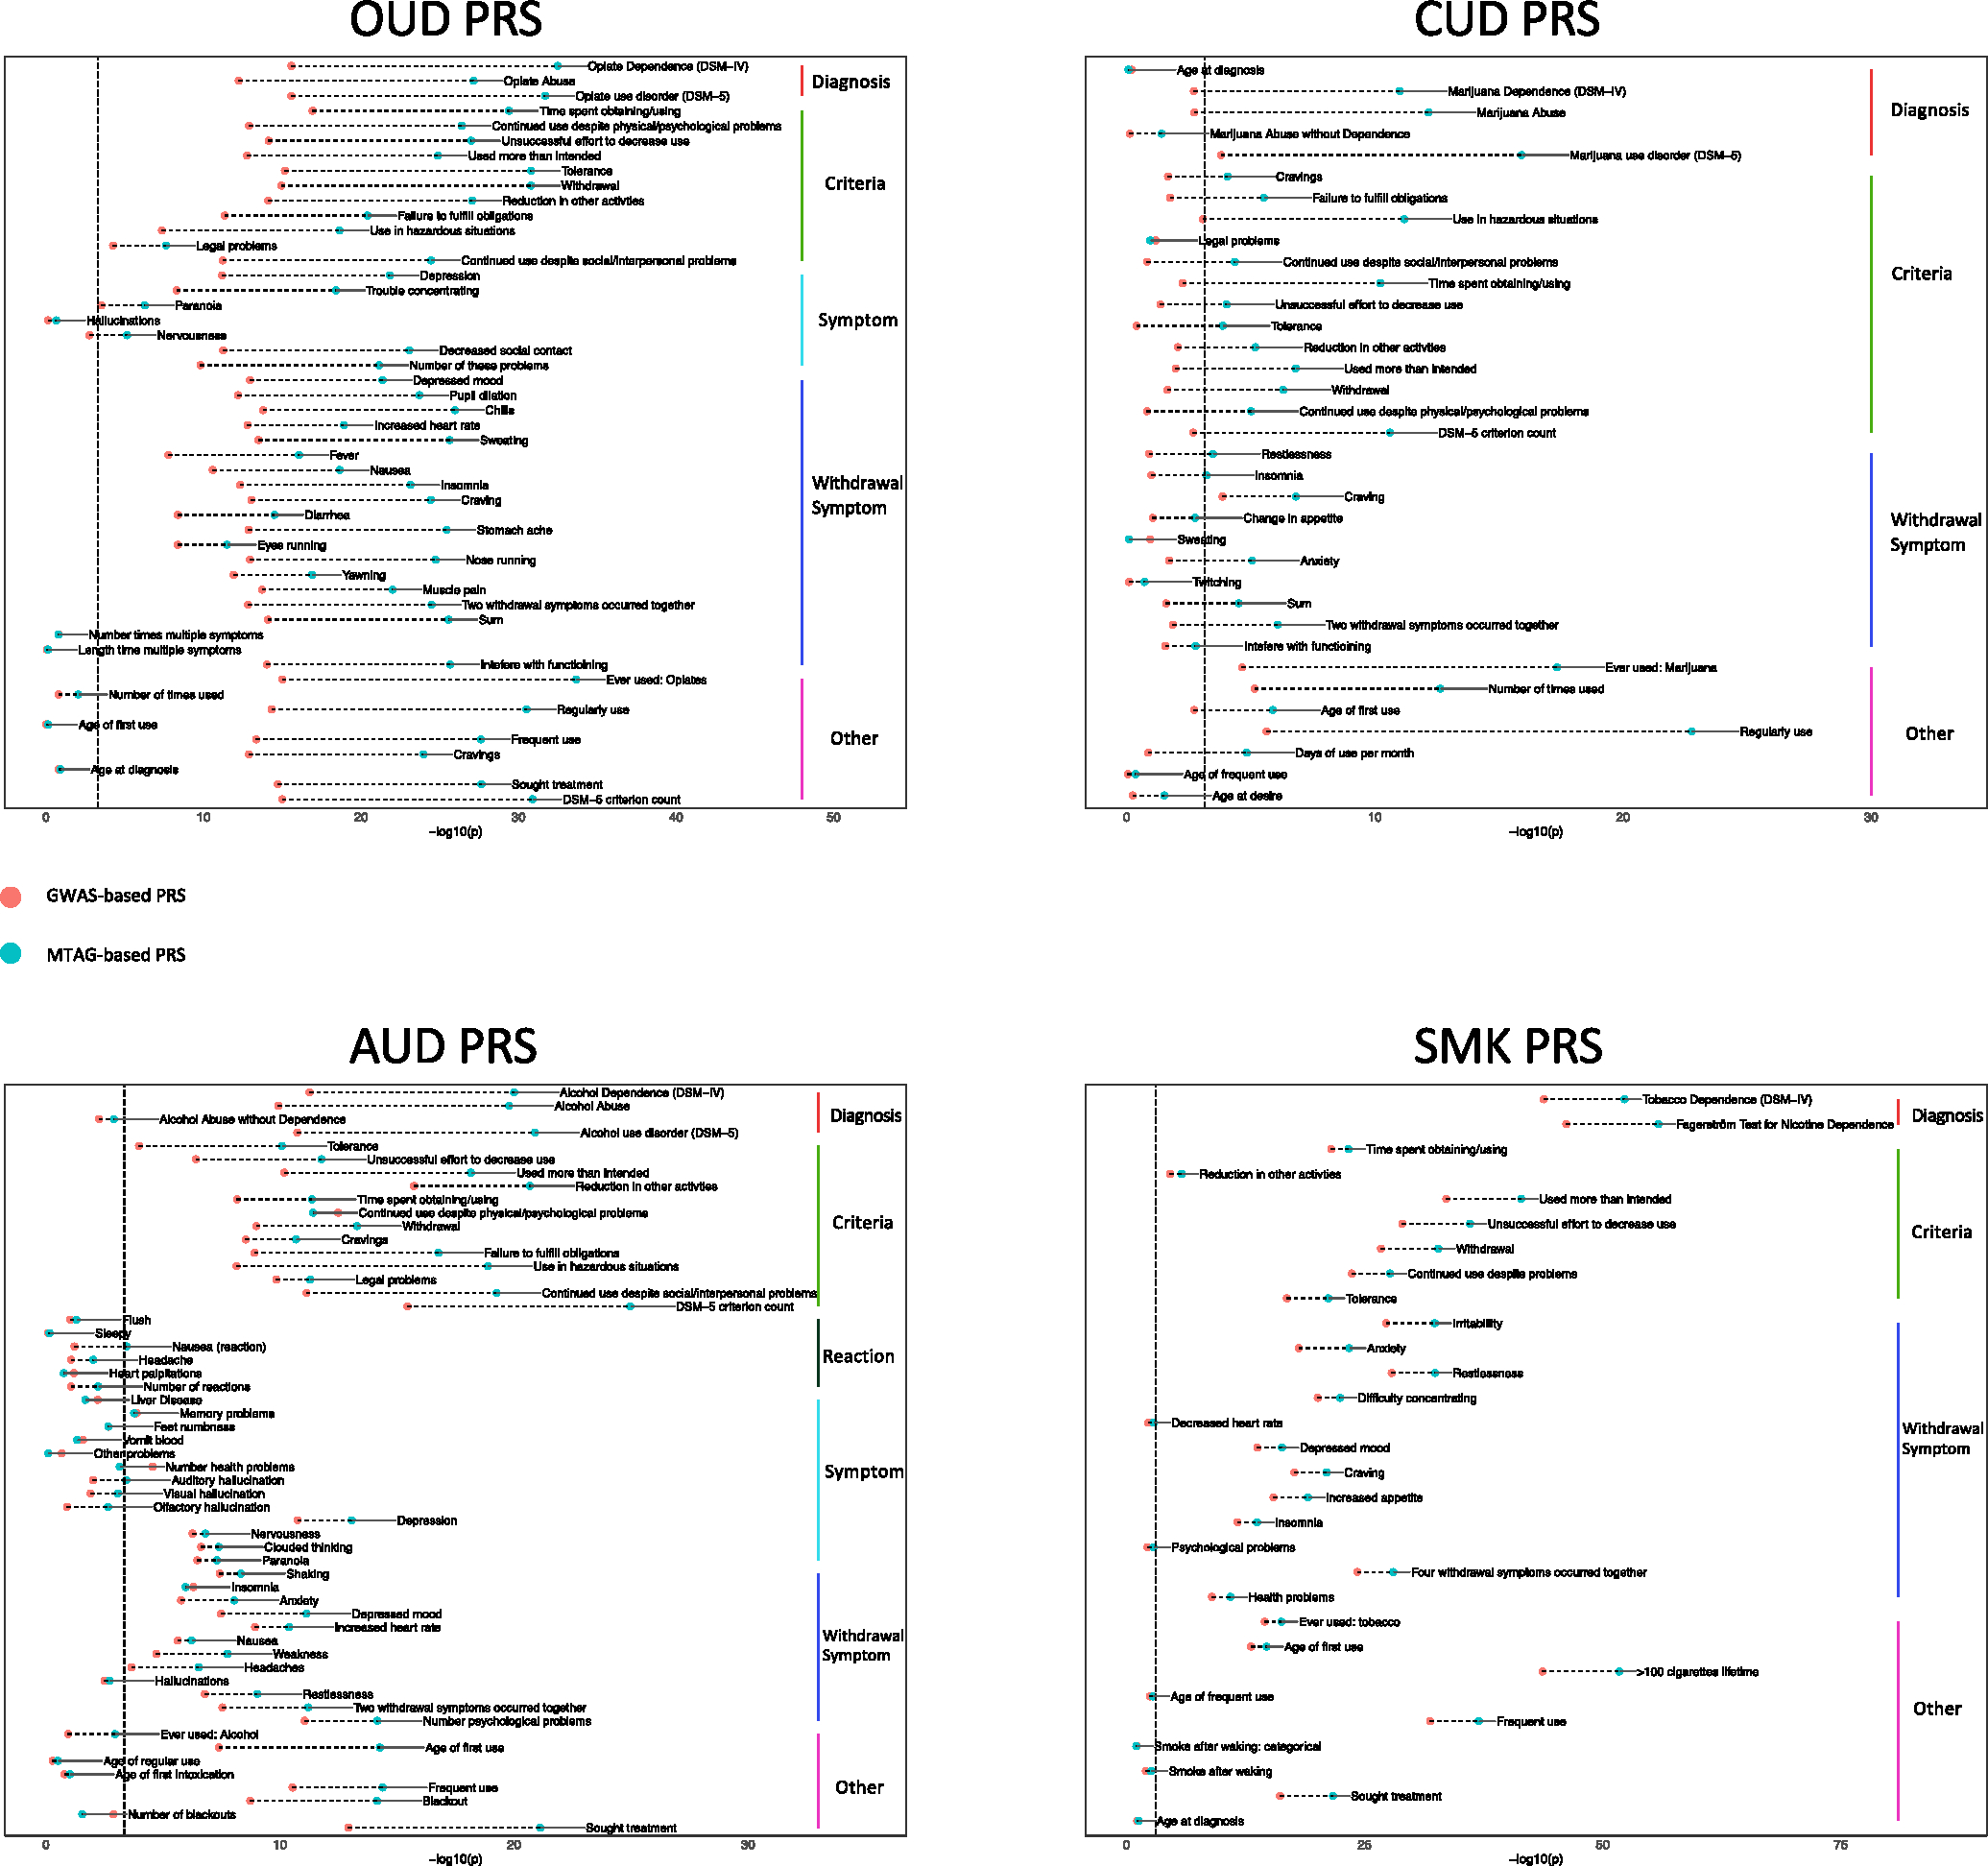
FIGURE 3.

Comparison of GWAS-based PRS and MTAG-based PRS. Red and blue dots in each plot represent the GWAS-based PRS and MTAG-based PRS, respectively. Vertical dashed lines indicate significance threshold after Bonferroni correction. GWAS, genome-wide association studies; MTAG, multi-trait analysis of GWAS; PRS, polygenic risk scores.
