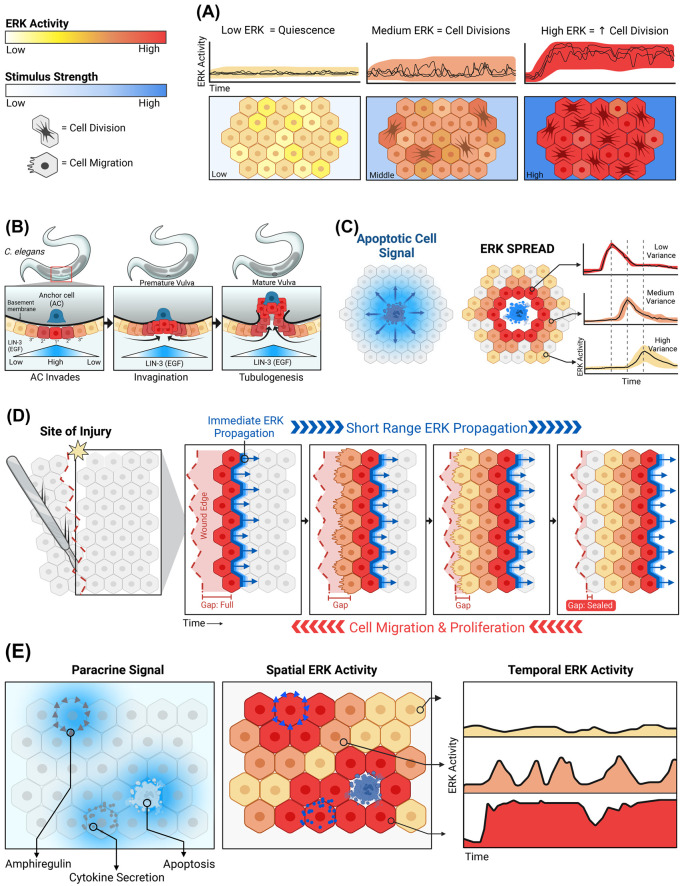
Figure 2. Functions of ERK dynamics during development and tissue homeostasis.
(A) ERK activity increases the probability of cell division. When exposed to different EGF concentrations (bottom panel, blue), single-cell ERK activity within a population varies from cell-to-cell (cell colors), increasing the average rate of proliferation [59,107]. (B) Spatially restricted ERK activity indicates cellular position during development. Within the C. elegans gonad, the anchor cell (AC, blue) is the point source for EGF ligand secretion, creating a gradient beneath the basement membrane (blue triangles below cells). Cells closest to the anchor cell receive the most stimulation and thus have the highest ERK activity (individual cell colors, red to yellow), inducing differential cell differentiation programs to create the mature vulva [80,81]. (C) Secretion of EGFR ligands from apoptotic cells creates a radial gradient around the dying cell. Cells closest to the center (red) have high ERK activity, which conveys a survival advantage, while cells farther from the dying cell receive a lower concentration of ligands (blue halo in left panel) resulting in lower and delayed ERK activity. Individual ERK activity traces are shown to the right. Figure adapted from Gagliardi et al. [87]. (D) During tissue injury, ERK activity provides both directional and migratory signals. Initially, cells adjacent to the injury have high ERK activity (first row, red cells) and secrete a short-range ERK stimulus gradient that activates its neighbors (abutting gradient, blue). Once the neighbors are activated, the ERK activity in the previous cell layer decays, ultimately creating a wave of ERK activity (second through fourth panel). ERK activation waves repeatedly propagate from the site of injury. This directs cells to migrate toward the site of injury (red arrows below) resulting in gap closure and wound healing [55,93,94]. (E) Multiple sources of ERK activation generate sporadic spatiotemporal ERK activation. Cells that actively shed EGFR ligands create transient, stimulatory microenvironments (blue gradients), in contrast with (A) which depicts uniform stimuli. These dynamic and overlapping microenvironments create varying temporal patterns of ERK activity, generating diverse gene expression profiles within the population [24].

