
Figure 1. Cell death-related genes are upregulated in SARS-CoV-2 infected HAE-ALI.
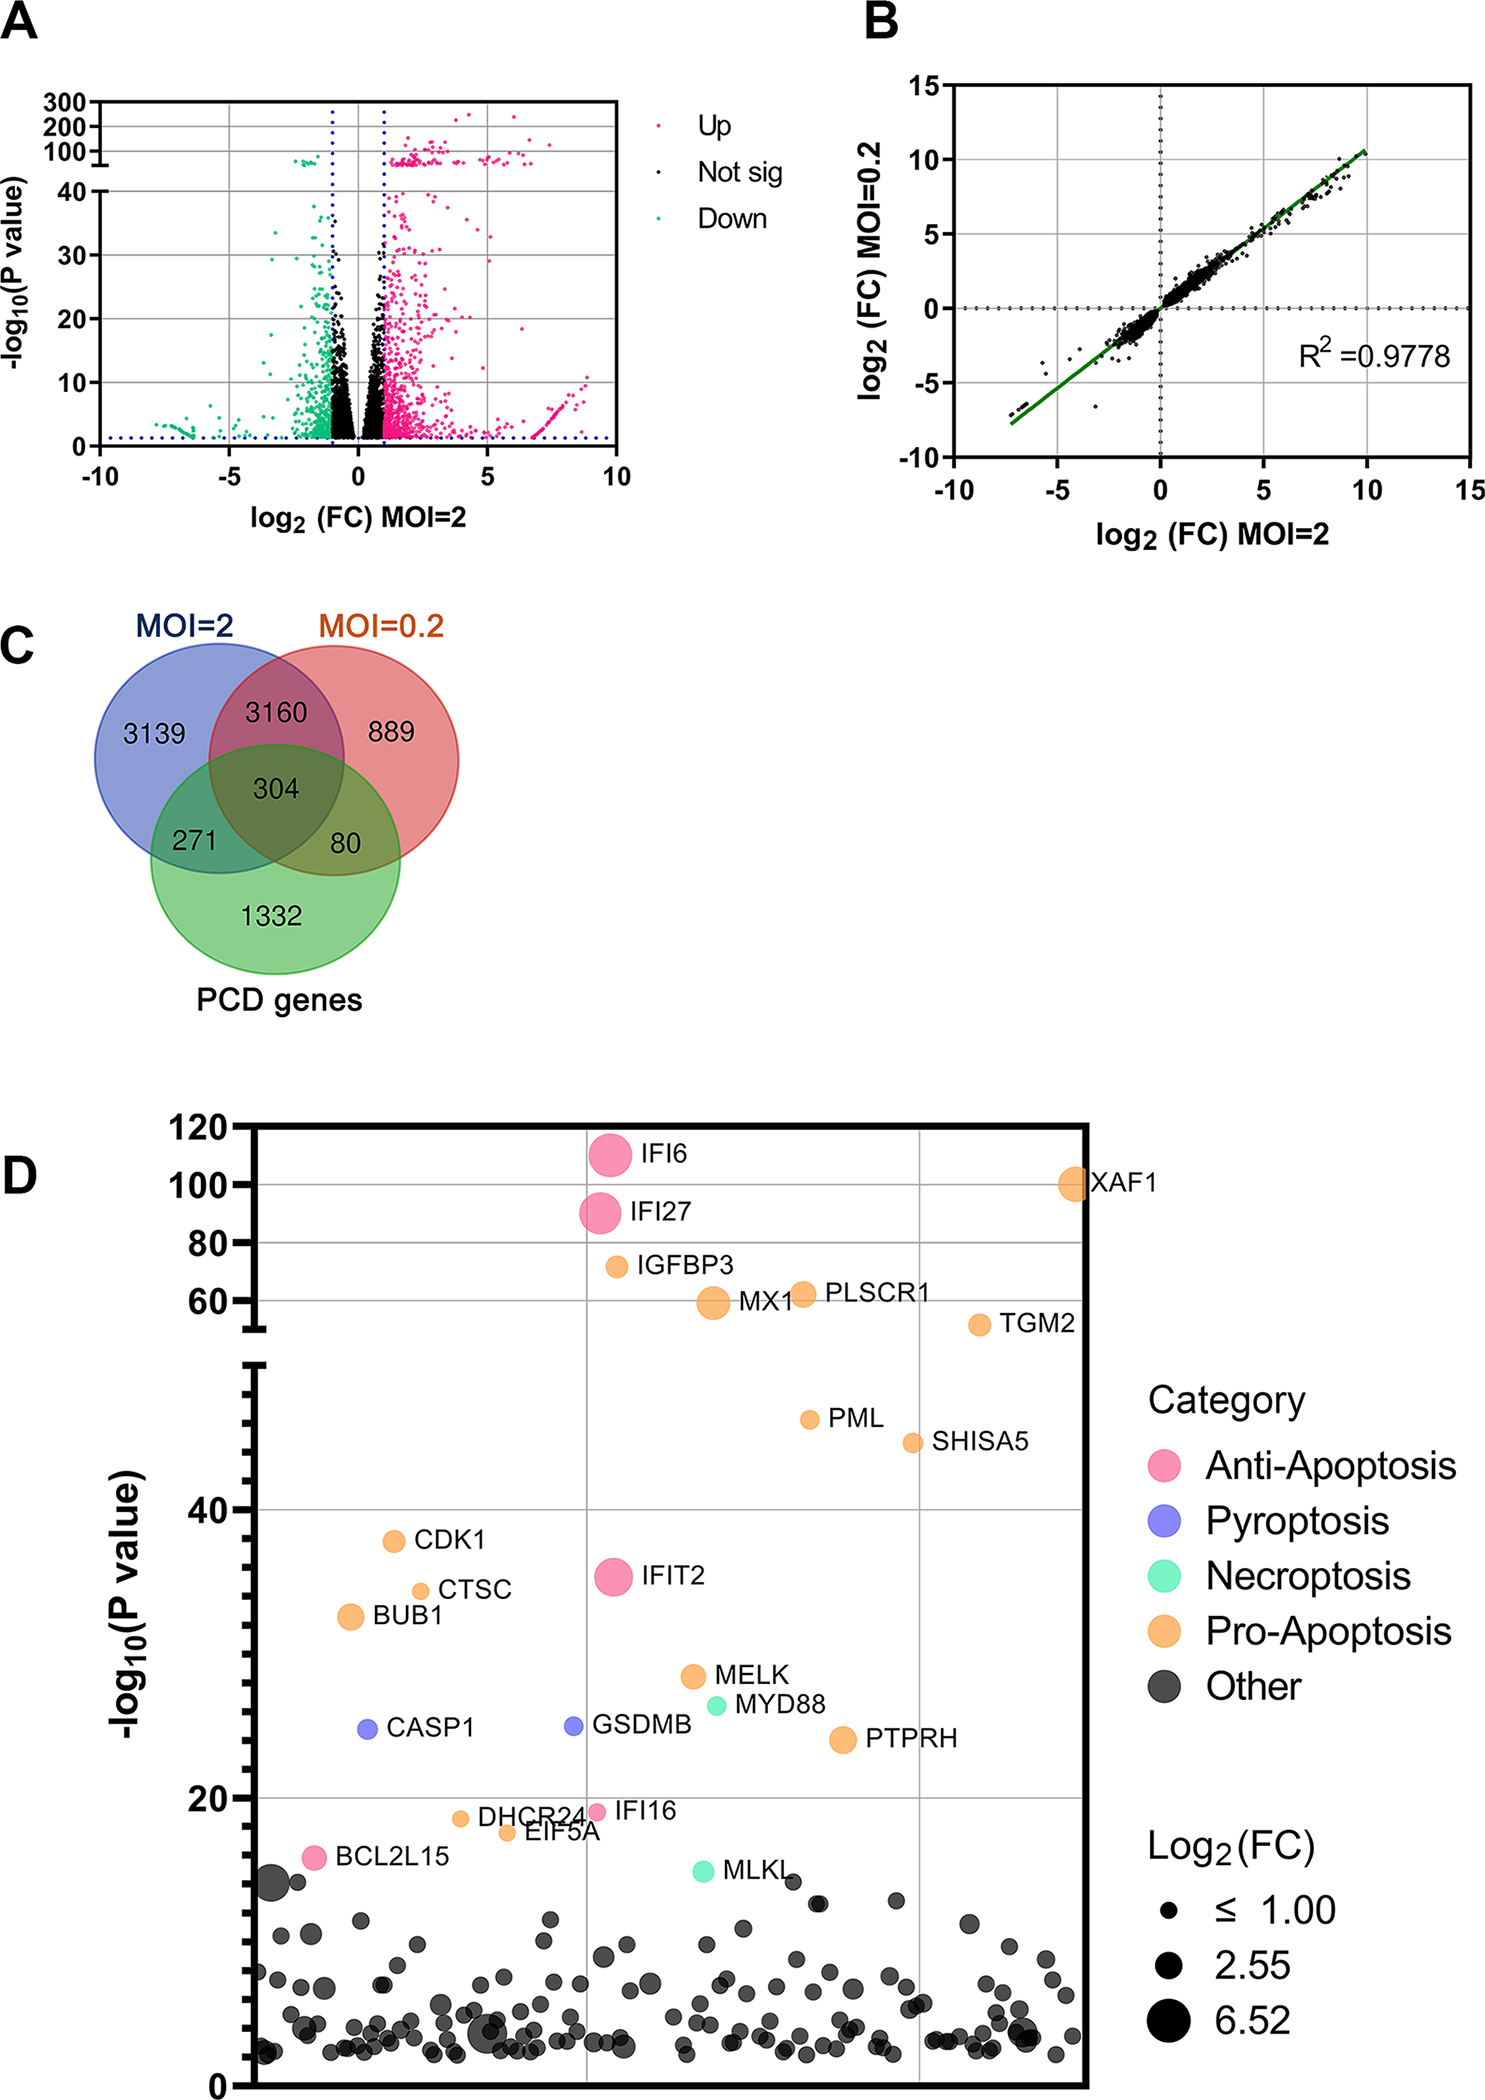
(A) Analysis of RNA-seq. The volcano plot displays statistical significance (−log10 P value) versus magnitude of change (log2 fold change) on the differentially expressed genes from RNA-seq data between HAE-ALI infected with SARS-CoV-2 (MOI=2) and mock-infected. All data selected at the criteria p < 0.05. Red dots indicate upregulated genes of >2-fold increase, and green dots indicate downregulated genes of >2-fold increase. (B) Data correlation between MOIs. Scatter plot of the fold change on all genes of HAE-ALI infected with SARS-CoV-2 at MOIs of 2 and 0.2, respectively, compared to the mock infected. The correlation R2 value is 0.9778. (C) Changes of overlapped genes. VENN plot of the genes related to PCD (Green) with the upregulated genes in the HAE-ALI infected with SARS-CoV-2 at MOIs of 2 (Blue) and 0.2 (Pink). (D) The top 100 upregulated genes related to cell death of the HAE-ALI infected with SARS-CoV-2 at MOI of 2. The y axis shows significance of hit based on the analysis. The bubble diameter indicates the fold change of individual gene enriched in SARS-CoV-2 infected HAE-ALI, compared to unselected controls. Different colors indicate the variety of the cell death pathway category.