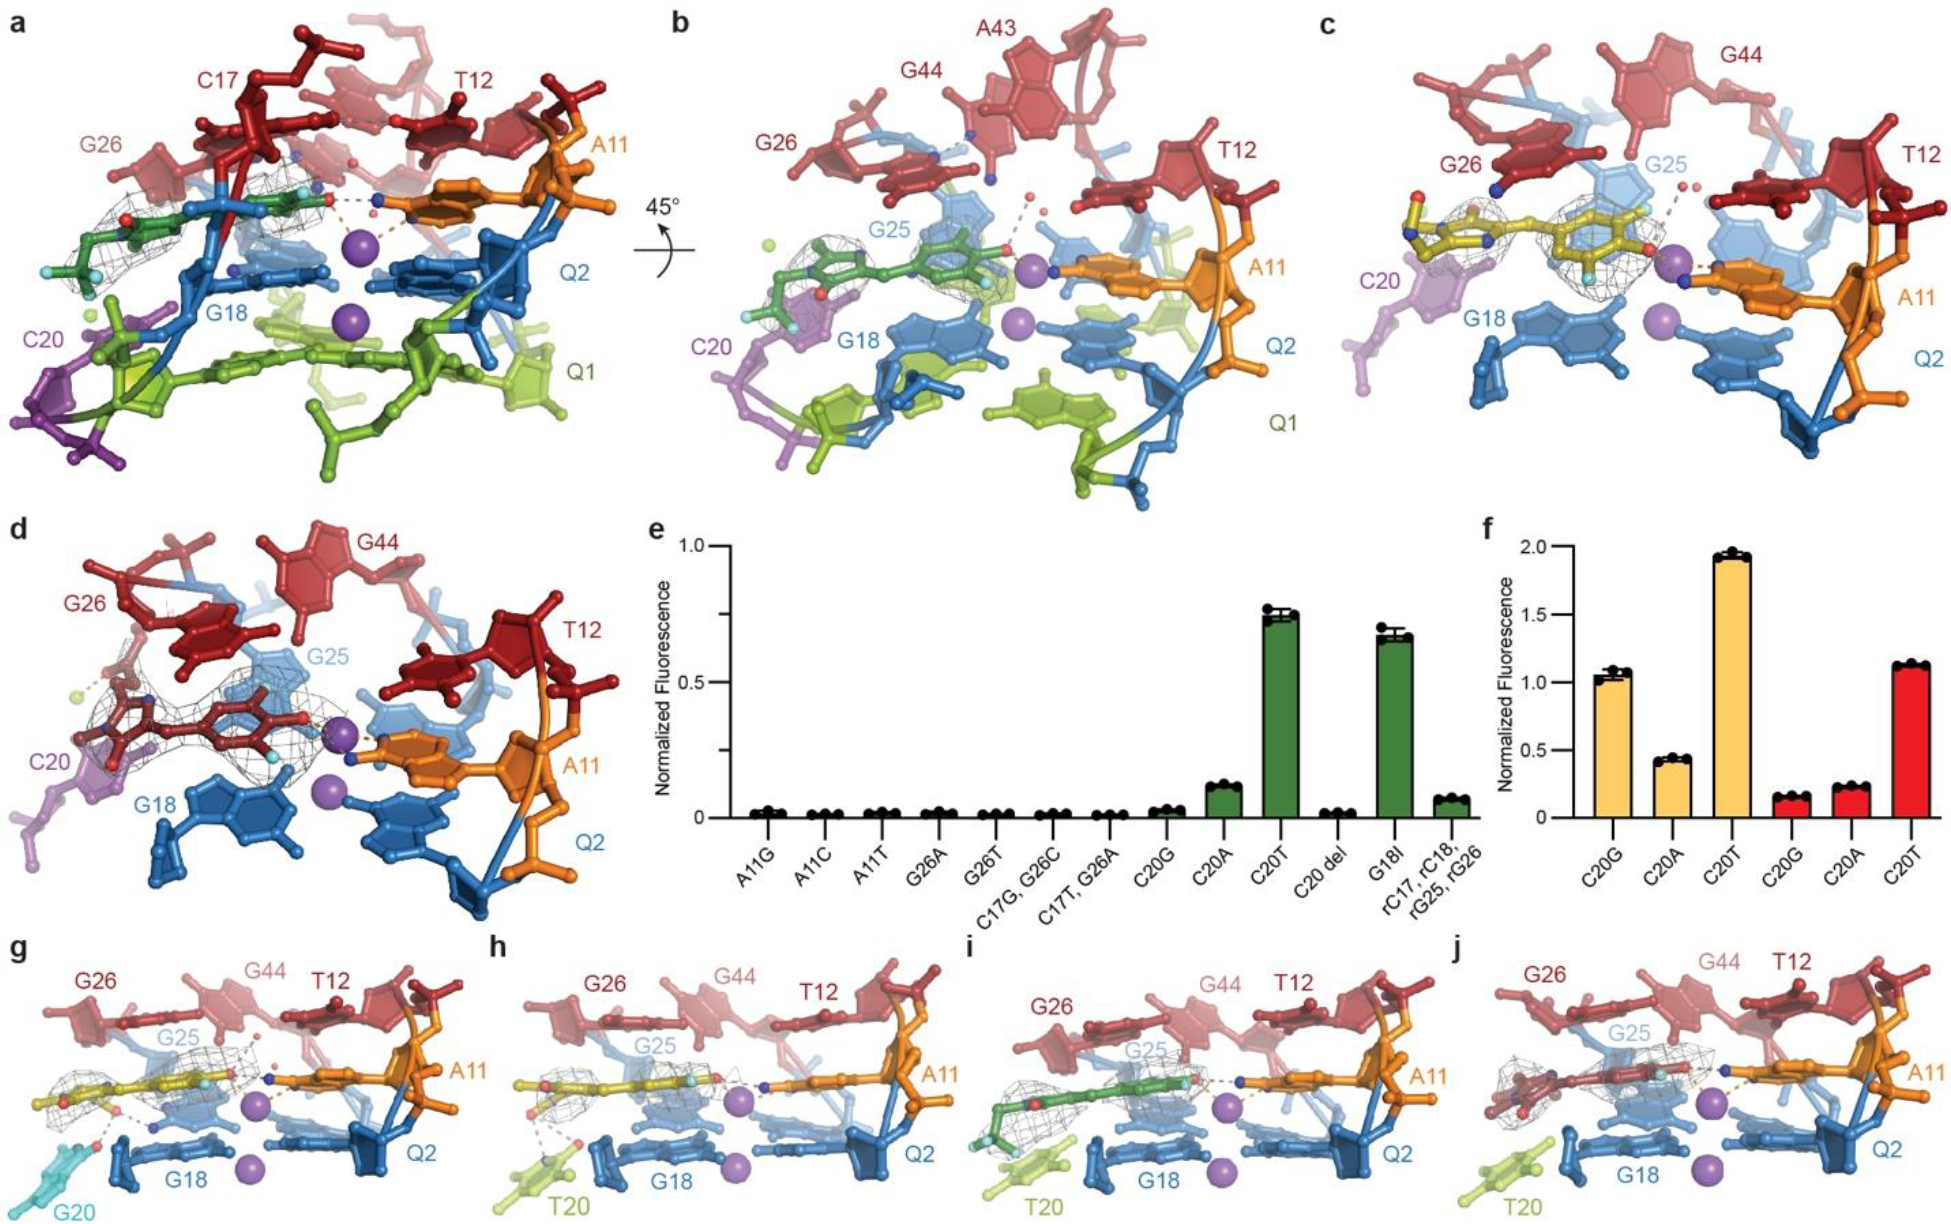
Fig. 2. The Lettuce fluorophore binding site.

a, View of bound DFHBI-1T. Gray mesh depicts the |Fo| − |Fc| electron density map before building the fluorophore, contoured at 3.0 standard deviations above mean peak height (σ). Gray and orange dashed lines denote hydrogen bonds and metal ion coordination, respectively. Red spheres are water molecules. b, Orthogonal. c, View of bound DFHO. d, View of bound DFAME. Gray mesh depicts the |Fo| − |Fc| electron density before building the fluorophores, contoured at 3.0 (c) or 2.0 σ (d). e, Fluorescence of site-directed mutants of the binding site in the presence of DFHBI-1T, normalized to wild-type (mean ± s.d., n ≥ 3). f, Fluorescence of C20 mutants of Lettuce in presence of DFHO (yellow bars), and DFAME (red bars), normalized to wild-type bound to each fluorophore (mean ± s.d., n ≥ 3). g, View of the Lettuce C20G binding site with bound DFHO, h, Lettuce C20T binding site with bound DFHO, i, Lettuce C20T binding site with bound DFHBI-1T, and j, Lettuce C20T binding site with bound DFAME. Gray mesh depicts the |Fo| − |Fc| electron density map before building the fluorophores, contoured at 3.0 (g, h, and i) or 2.0 (j) σ.
