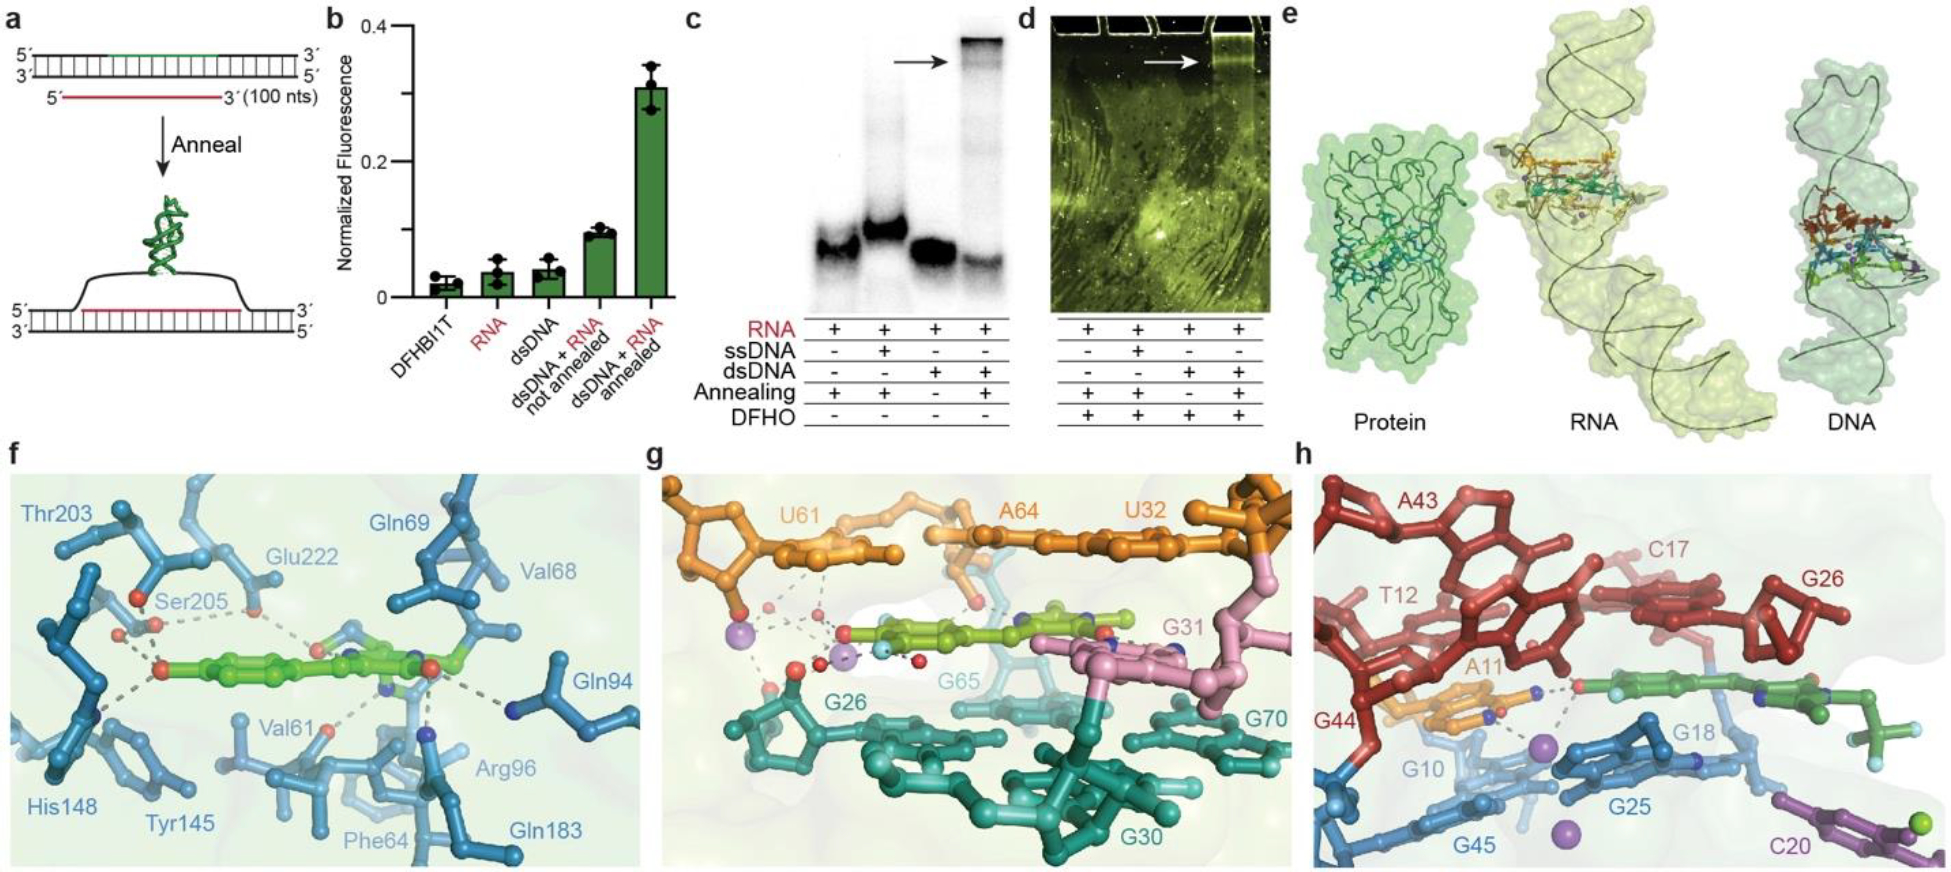
Fig. 4. Detection of R-loop formation by Lettuce, and comparison with RNA and protein counterparts.

a, Schematic of R-loop assay. b, Fluorescence of DFHBI-1T in the presence of buffer, RNA, dsDNA, dsDNA + RNA not co-annealed, dsDNA + RNA co-annealed, normalized to wild-type Lettuce (mean ± s.d., n ≥ 3). c, Non-denaturing PAGE. Arrow denotes R-loop. d, Fluorescence of same gel as in c, after soaking in DFHO. Arrow denotes R-loop. e, Molecular surfaces and cartoons of GFP36, Spinach38, and Lettuce, to scale. f, GFP chromophore site36. g, Spinach bound to DFHBI38. h, Lettuce bound to DFHBI-1T.
